

FP&A: from performance to a plan
Follow a performance gap into budgeting, rolling forecasts, workforce costs, cash planning and approval workflows.
8:34 · Product walkthroughDemonstration data and modelled examples. Results shown are not achieved customer results.
Video transcript (automatic)
Your revenue is growing. So why are you still behind plan? And when leadership asks what to do next, how quickly can your team answer? DataNova FP&A brings performance, planning, and decisions into one workspace. Let's follow the numbers, test the options, and turn the conversation into a plan. Here, we're looking at UK performance through September, comparing actual results with the latest forecast and the previous year. Revenue is growing. EBITDA is ahead of last year, but it's still around 1.4 million pounds below forecast. So what's driving the gap? Click the EBITDA figure to see the accounts behind it. Which contributions helped? Which held performance back? And how do they reconcile to the headline number? Open the supporting monthly records, investigate the movement, then return with the original reporting context intact. Finance and operational leaders can explore the same evidence together without asking someone to rebuild the analysis for every follow-up question. The dashboard becomes the start of the discussion with a clear route from the headline to the detail. Now let's change the plan. The budget workbench feels familiar, like a spreadsheet, with a shared SQL database behind it. Here, January's technology budget becomes 90,000 pounds. Monthly and line totals recalculate, and the change is saved. Switch between monthly, quarterly, and annual views. Configure up to 20 descriptive columns around your departments, cost centers, and planning needs. Approved lines stay locked, so teams can develop the draft without changing the figures already agreed. What happens when the business changes halfway through the year? Keep the original budget, create a reforecast, and save alternative scenarios without overriding your starting point. This version combines actual results through September with 18 future months, taking the planning horizon to March 2028. Actual months stay locked. Future months remain open for planning. Clone a version, give it a name, adjust the assumptions, and compare the result. Each saved version keeps its own basis, giving the team a consistent reference for the next decision. Start with people. Model a proposed hire using salary, full-time equivalent, start date, employer costs, and bonus. Here, a commercial planning analyst adds approximately 120,000 pounds across the selected horizon. The proposal sits alongside the existing people-cost baseline, so its additional financial impact is visible before anyone commits. Then test the assumptions behind growth. What if prices increase? What if volumes improve? And what if supplier costs rise at the same time? Driver-based planning translates those assumptions into financial outcomes, so commercial and finance teams can discuss the decisions behind the numbers. Planning an investment? This warehouse automation proposal separates the upfront cash commitment from depreciation, making both the cash cost and the impact on profit visible. And can the business fund the plan? Test collection days, supplier payments, and inventory assumptions against projected cash and headroom before tax and financing. The same workspace is available in light and dark mode. Now compare the saved base and upside scenarios side by side. Across this planning horizon, the upside produces approximately 2.46 million pounds more modeled EBITDA. The important question is what creates that difference? The account bridge shows the contributions, including the additional cost of the proposed hire. Leadership can challenge the assumptions and assess the trade-offs together. It's a modeled opportunity, not a promised result. A clearer basis for deciding what to do next. Click a month on the chart to inspect the evidence behind the scenario. The selected version, period, and comparison stay with the analysis so the discussion can move into detail and back again without losing its place. Financial trends brings actual performance, the previous year and the selected planning alternative together. The reporting cutoff makes the boundary between actual results and future plans clear. Use the charts to explain the story, investigate an unexpected movement, or take a visual into the next management presentation. What does the historical pattern suggest, independently of management's assumptions? Predictive Forecast adds a machine learning outlook tested against past results and a seasonal baseline. Review its coverage and measured error alongside the business plan. It's another perspective to evaluate, with your team keeping control of the decision. The CFO briefing turns calculated evidence into a focused executive discussion. AI-generated commentary groups the findings into attention required, positive performance, and monitor, with supporting figures and links to the evidence. Leaders can see what deserves attention, then investigate further. The commentary supports judgment. It doesn't approve changes, and explanations still need to be checked against the evidence. You've identified the gap. Who owns the response? Close the gap connects the target to specific initiatives, accountable owners, and proposed financial impact. Here, a logistics initiative addresses 180,000 pounds. The remaining gap stays visible, and proposed benefits remain separate from results already achieved. When it's time to share the decision, the reporting context travels with it. Export the selected scenario to CSV, produce a Decision Pack PDF, or download a chart for a presentation. Take the same version into a leadership meeting, a detailed spreadsheet review, or a wider planning discussion. The selected periods and scenario remain clear to the next reader. A plan also needs a clear route to agreement. Configure sequential approval stages around the relevant planning roles, with controlled access and an audit trail. Submitted work is locked during review. Submitters can't approve their own submissions. Here, we're viewing an existing approved version. Its figures are frozen, and the history records the decisions behind it. To explore another change, clone it into a new draft. Teams have room to iterate while preserving the version leadership actually approved. You don't have to connect every system to get started. Use FP&A as a standalone workspace, uploading files or entering data directly. Start with a ready-to-use foundation, then configure the planning structure, terminology, and approval routes around your organization. And where your process needs more, we can tailor the workflows with you. When you need the wider picture, connect your business data directly into FP&A. Bring ERP, CRM, finance, and operational data alongside your plans for a fuller view. Connections and mappings are configured for your environment. You can also publish agreed planning data sets into a Fabric lakehouse, ready for your reporting, analytics, and other applications to use. Start standalone or build it into your connected data platform. What would your team do with more time to plan and less time assembling the picture? See DataNova FP&A with your own business scenarios. Book a tailored demo at datanovalabs.com. Plan with confidence. Lead with clarity.
Explore this capabilitySee another workflow.
 8:58
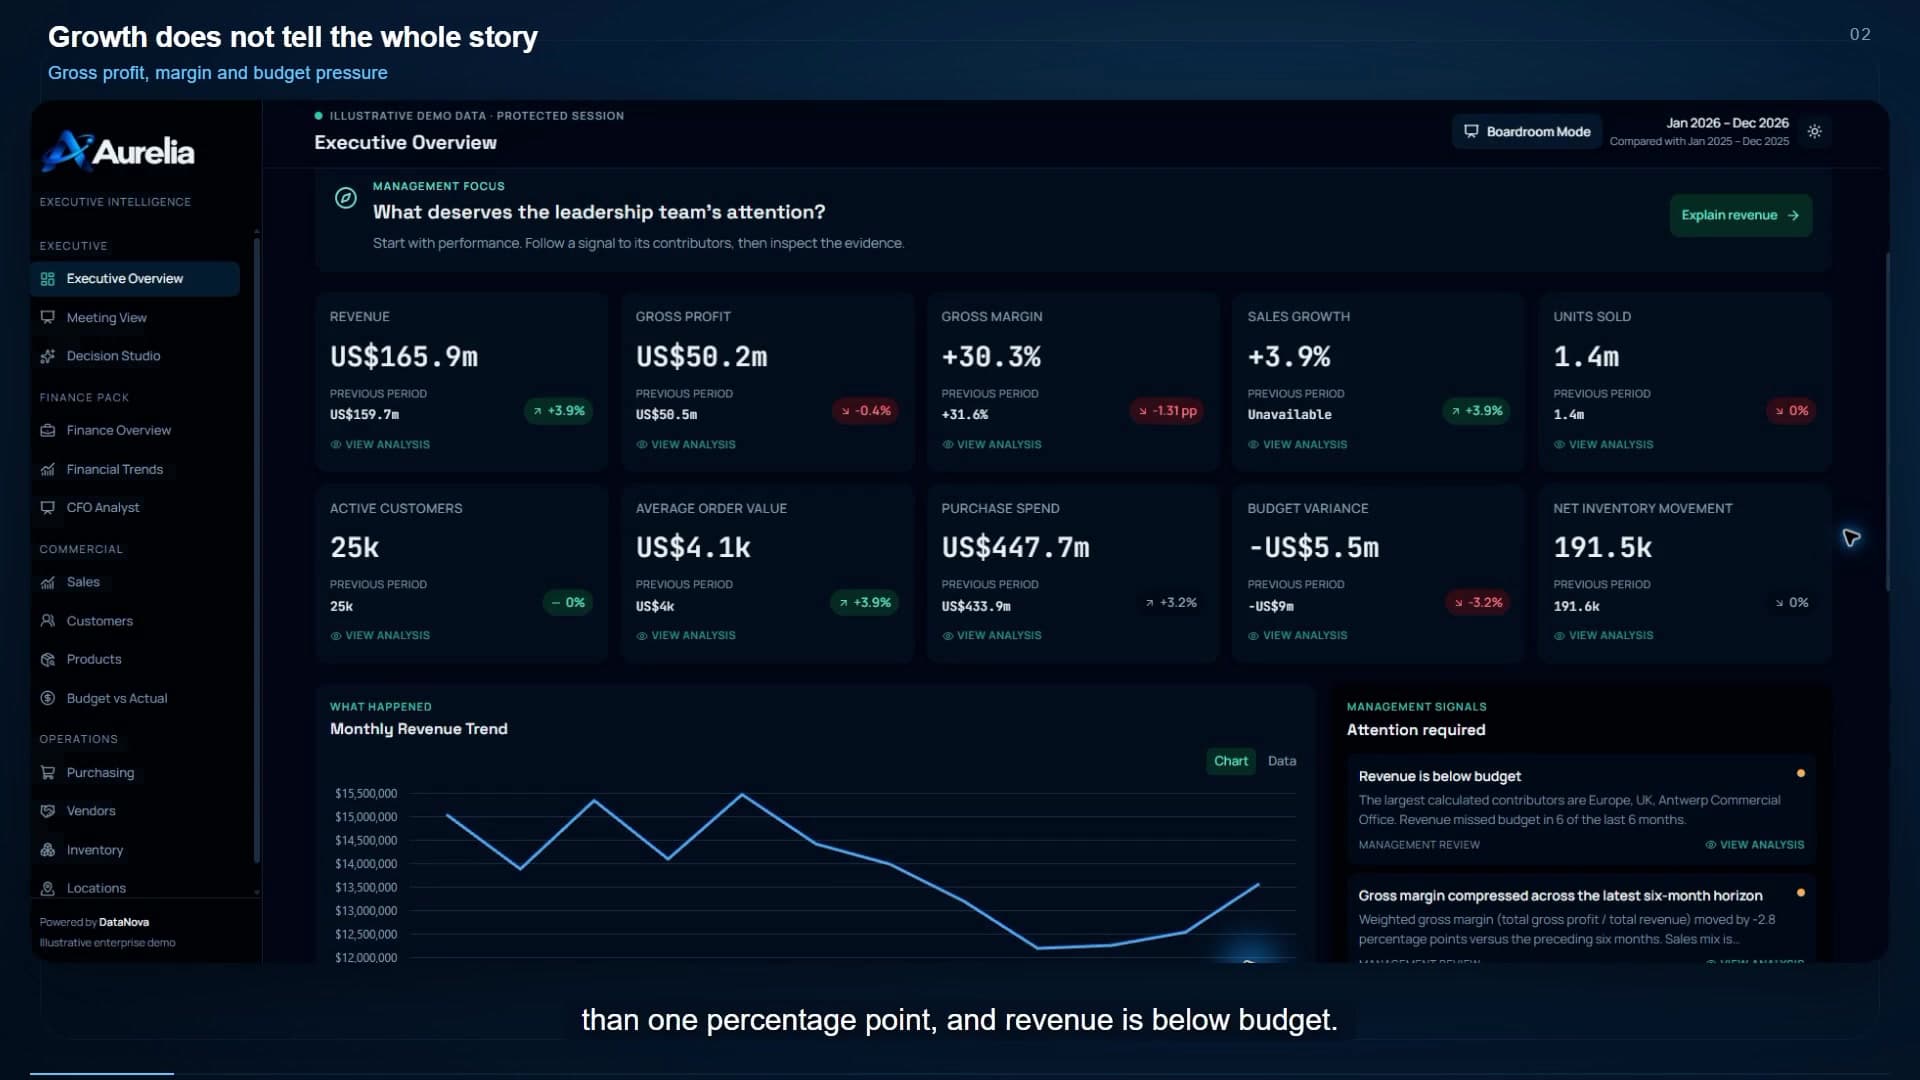
Aurelia: a business application in action
Explore reporting, financial evidence, custom models and email briefings in one connected business application.
 0:41
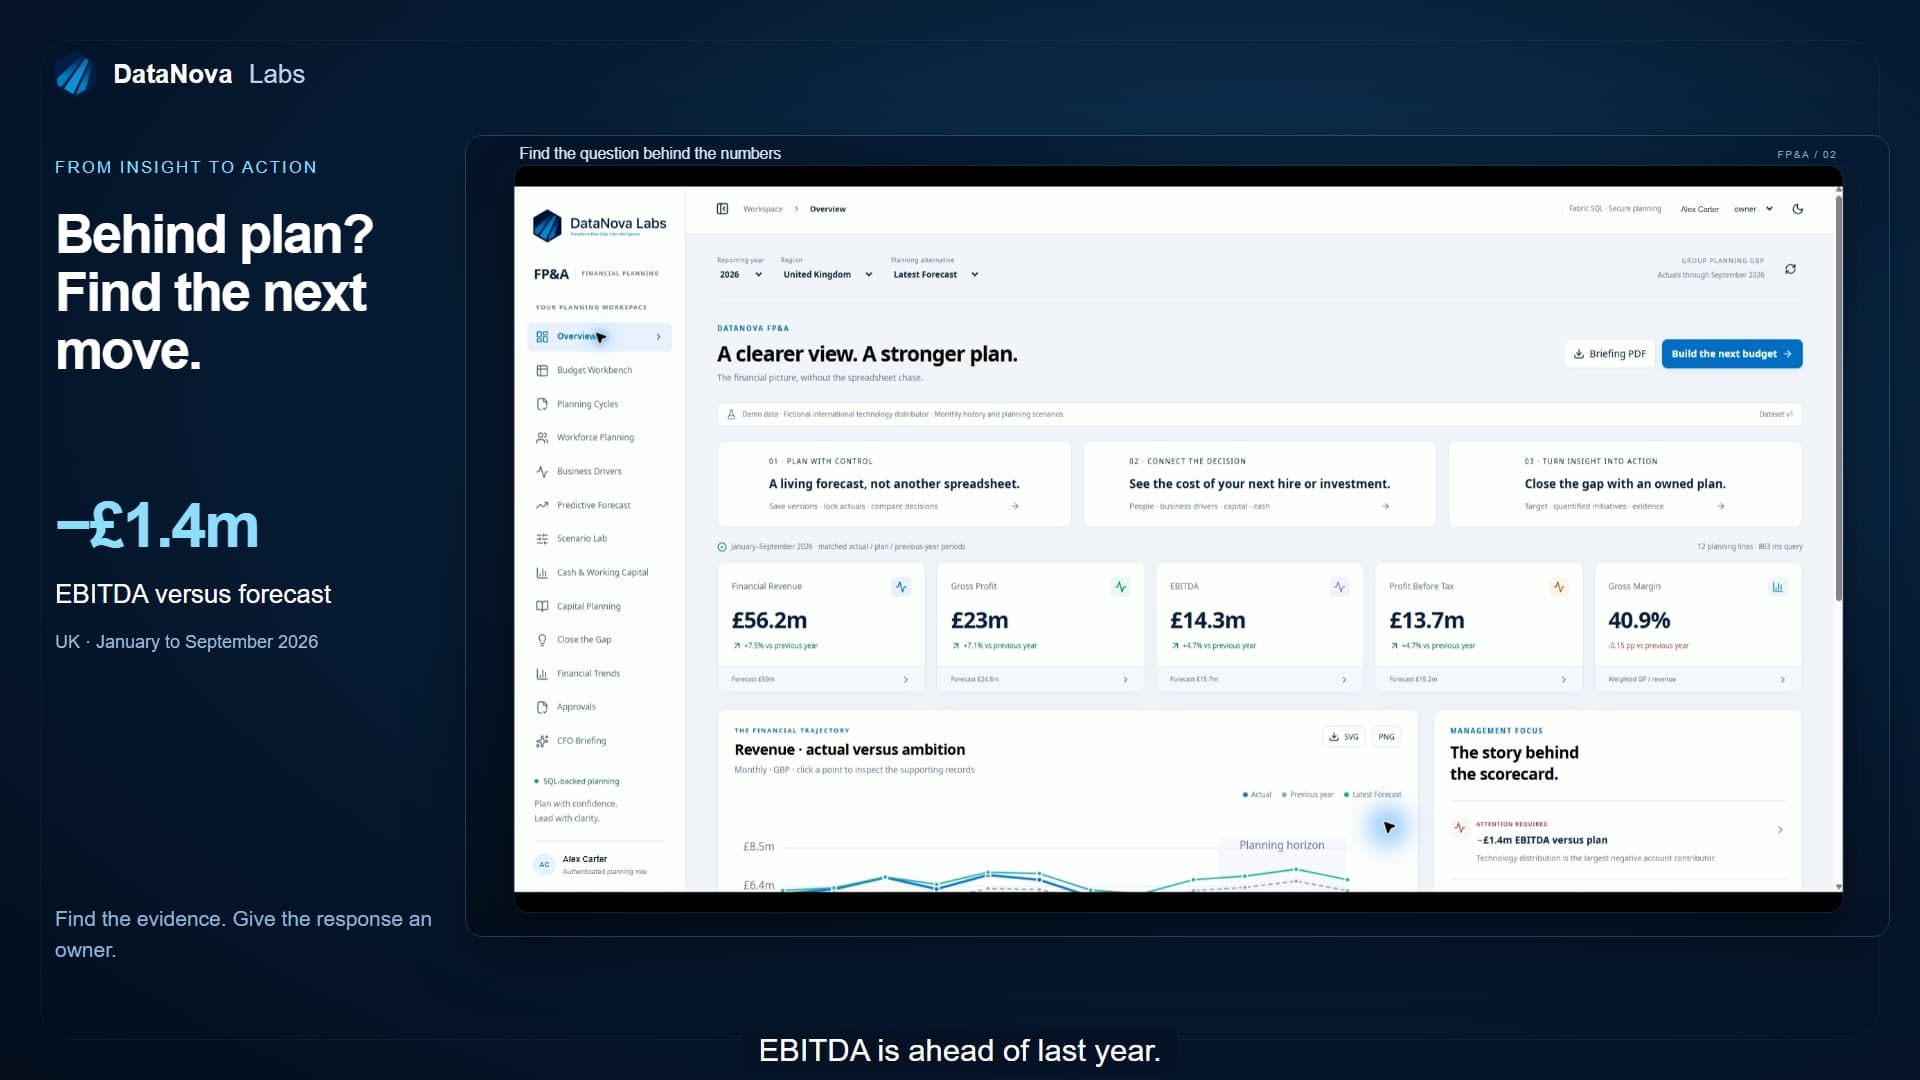
From the performance gap to the next action
Follow an EBITDA gap into its supporting accounts, then connect the response to initiatives and accountable owners.
 0:39
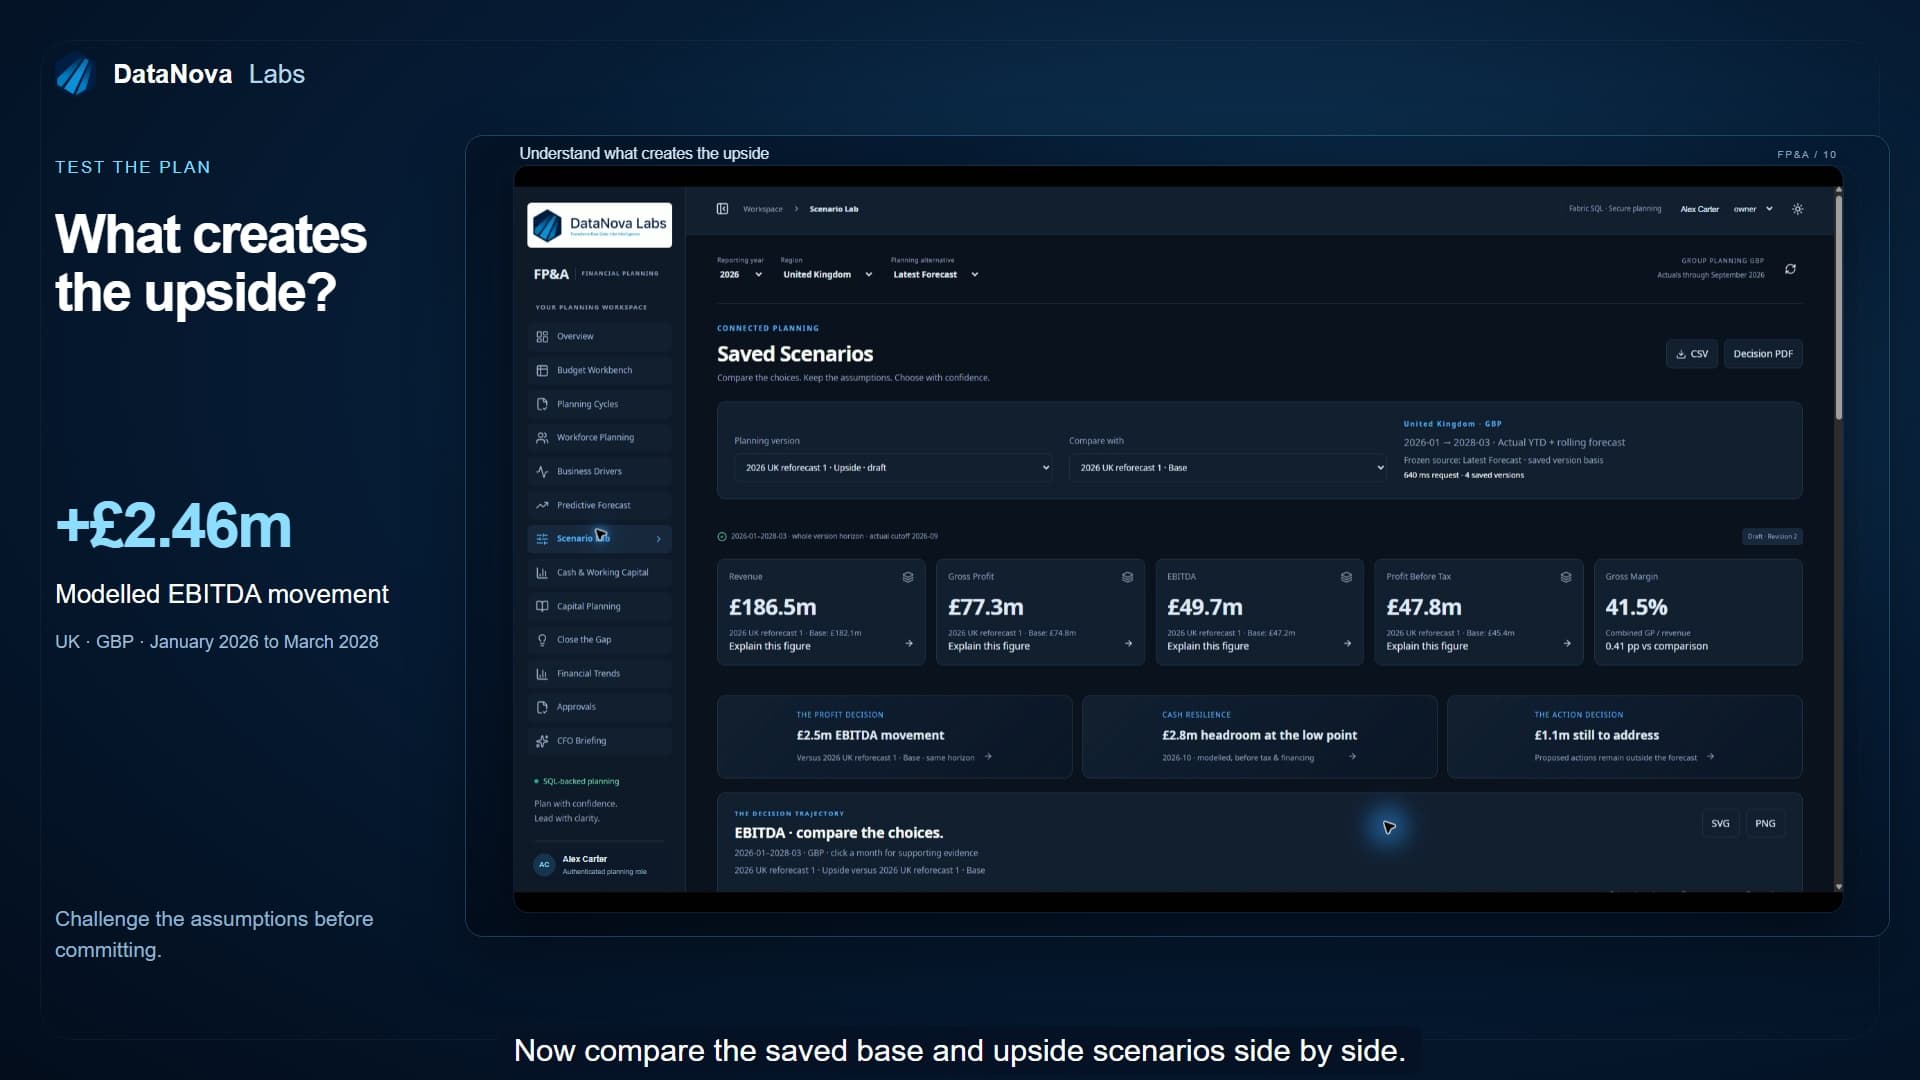
Compare scenarios and explain the difference
Compare a base plan with an upside scenario and inspect the account movements behind the modelled result.