

Compare scenarios and explain the difference
Compare a base plan with an upside scenario and inspect the account movements behind the modelled result.
0:39 · Product walkthroughDemonstration data and modelled examples. Results shown are not achieved customer results.
Video transcript (automatic)
Now compare the saved base and upside scenarios side-by-side. Across this planning horizon, the upside produces approximately 2.46 million pounds more modeled EBITDA. The important question is, what creates that difference? The account bridge shows the contributions, including the additional cost of the proposed hire. Leadership can challenge the assumptions and assess the trade-offs together. It's a modeled opportunity, not a promised result, a clearer basis for deciding what to do next.
Explore this capabilitySee another workflow.
 8:34
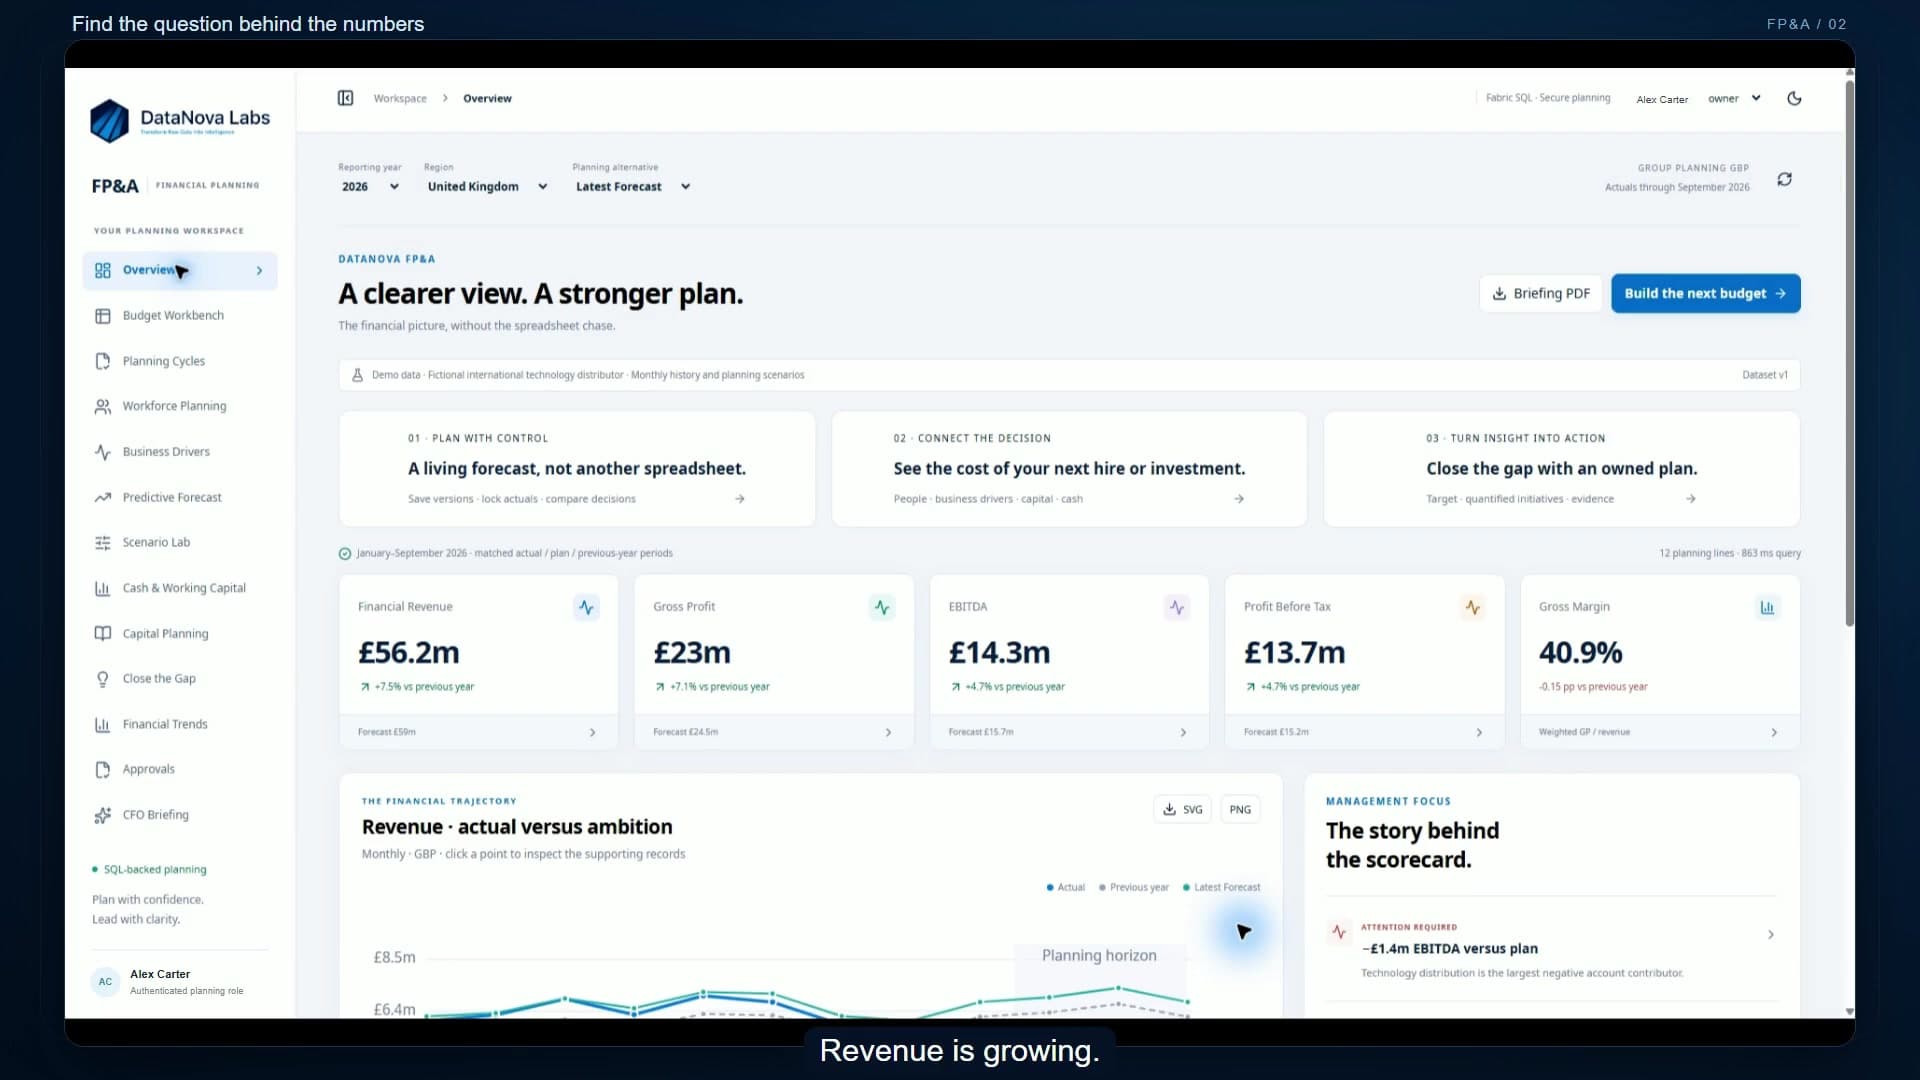
FP&A: from performance to a plan
Follow a performance gap into budgeting, rolling forecasts, workforce costs, cash planning and approval workflows.
 8:58
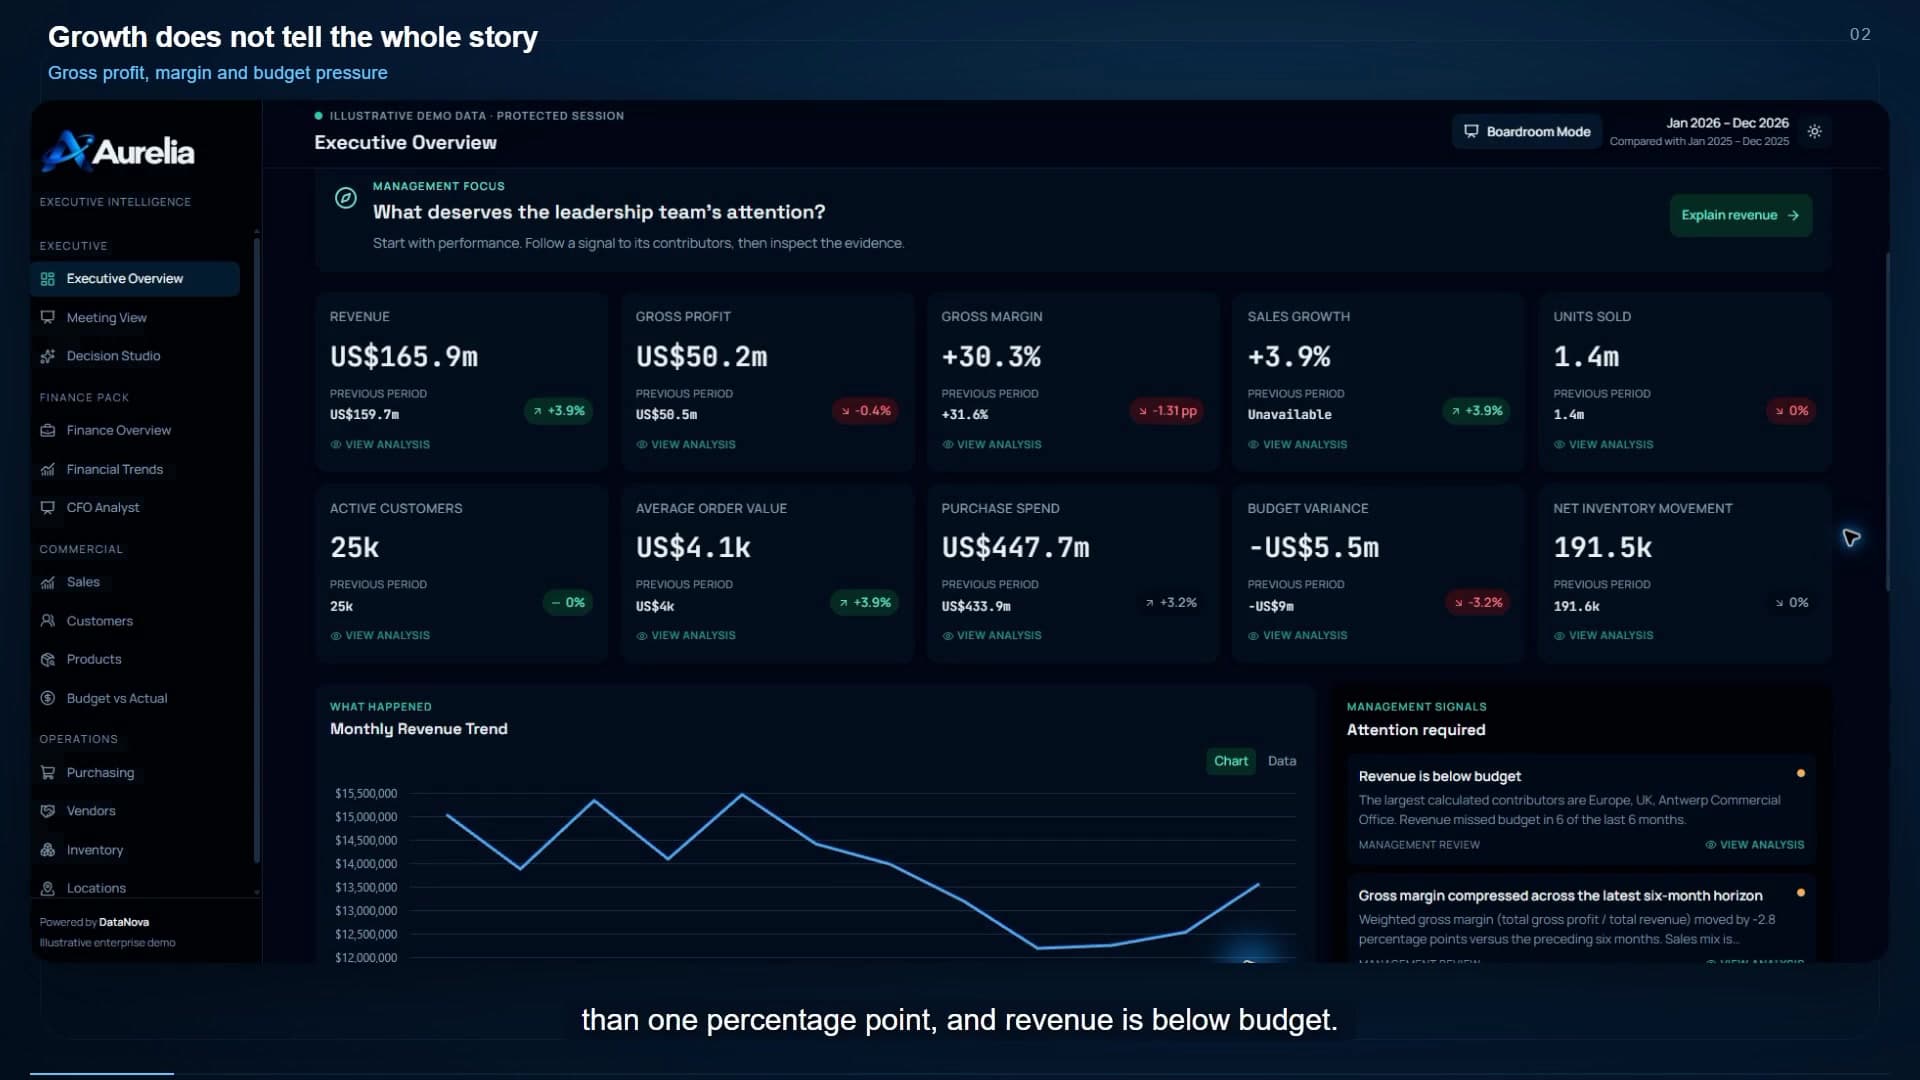
Aurelia: a business application in action
Explore reporting, financial evidence, custom models and email briefings in one connected business application.
 0:41
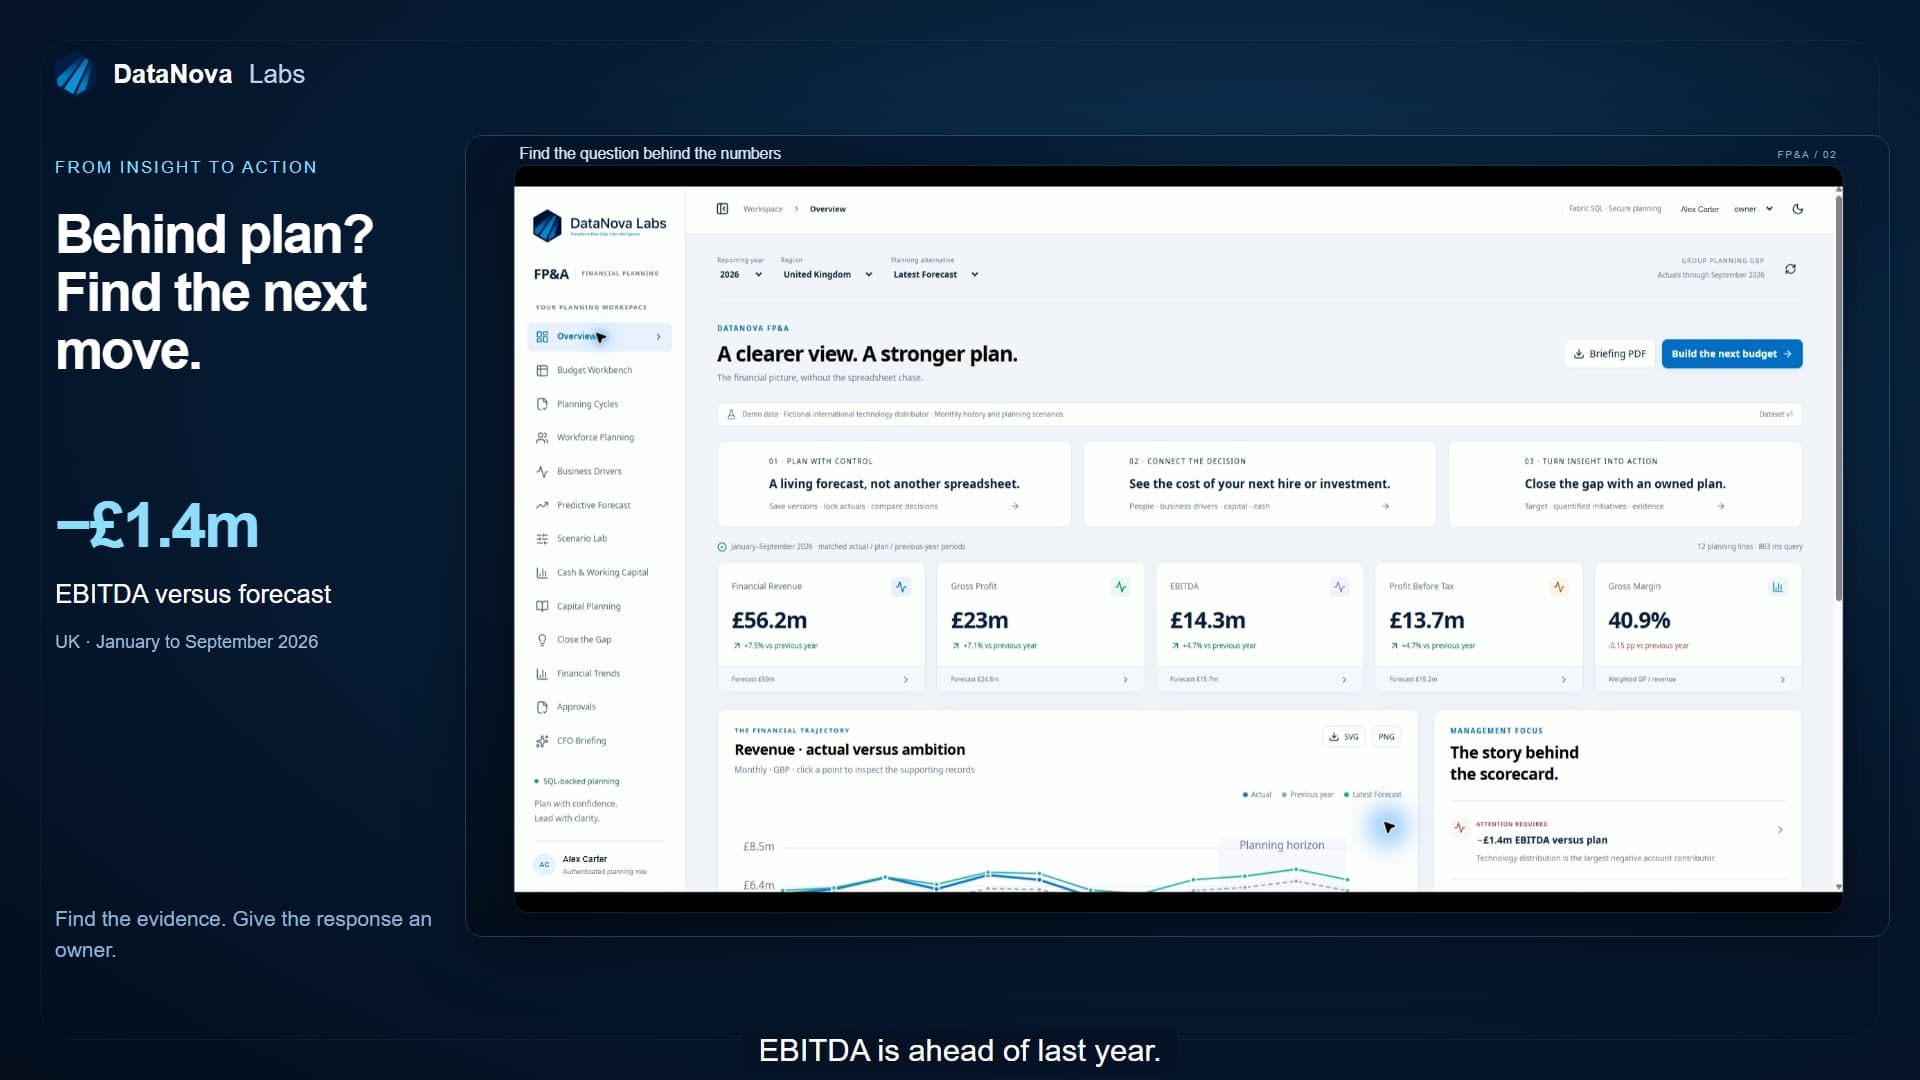
From the performance gap to the next action
Follow an EBITDA gap into its supporting accounts, then connect the response to initiatives and accountable owners.