

Explain a trend
Use a time-based view to compare performance over a consistent period and make changes easier to discuss.
Turn a plain English request into a chart from your business data. Refine the view, compare results and explore AI insights in DataNova.
Available in your DataNova workspace after signup. Card required at signup. No charge until your 30 day trial ends. Review the selected plan and trial terms.Nova AI Visual Builder turns a plain English request into a visual using data in your DataNova workspace. Choose a chart type, review the measure and grouping, and refine the result. It gives you a practical starting point for reporting without building every view from scratch.
Compare plans and trial routesThe visual creator shows the request alongside the chart, source, filters and AI insights. Keep the context visible while you refine the result.
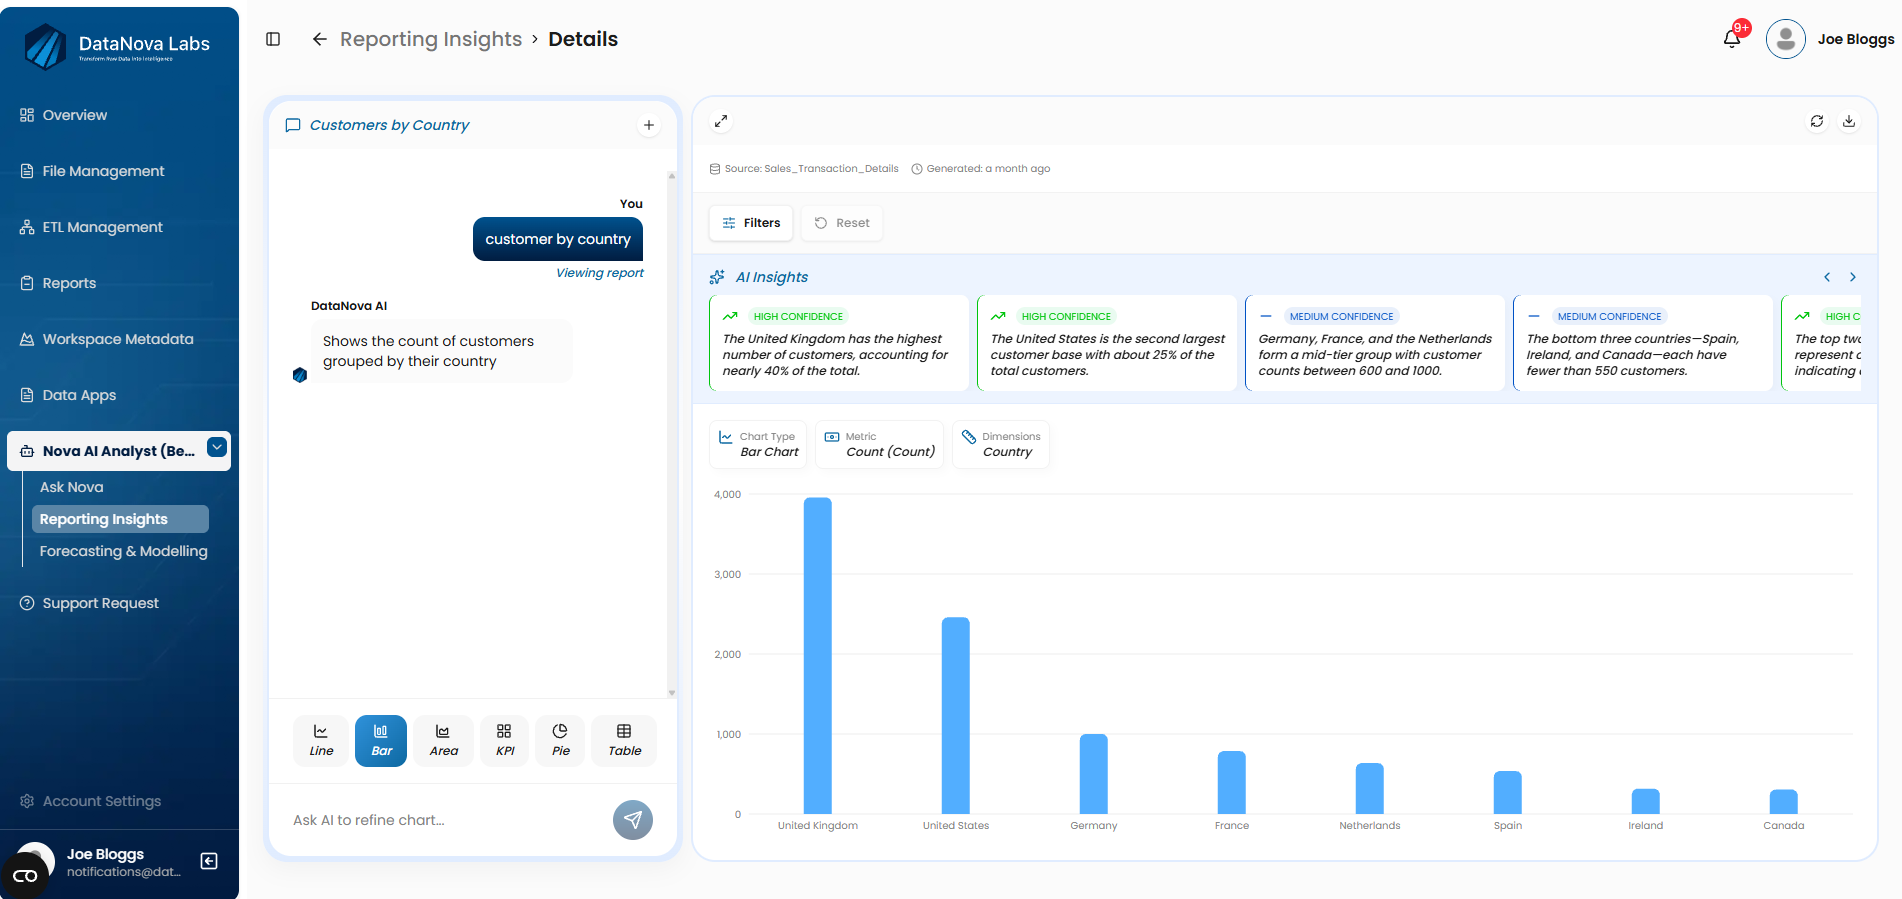
Demonstration figures illustrate the product. They are not achieved customer results.
Select the relevant data and say what you want to see. Name the measure, grouping and period where they matter.
Use line, bar, area, KPI, pie or table views as appropriate. Inspect filters, measures and dimensions to check what the chart represents.
Ask a follow-up prompt, adjust the view and use the available image or CSV export. Review the numbers before putting them in a report.
Use a time-based view to compare performance over a consistent period and make changes easier to discuss.
Bring countries, regions or products into a clear comparison. Choose the grouping that answers the business question.
Turn a recurring question into a visual starting point, then refine its scope for the people making the decision.
Understand the workflow, the data it needs and the right trial route.
It creates a chart or report view from a plain English request using data in your workspace. You can refine the request and inspect the chart type, measure, dimensions and filters.
The visual creator offers line, bar, area, KPI, pie and table views. Choose a format that suits the data and the comparison. The available result depends on the fields in the selected data.
You can begin with a prompt and use the visual controls without writing code. Your data still needs suitable fields and definitions. We can help scope source mapping or a tailored report if the requirement goes beyond the standard workflow.
AI visual creation is available in the standard DataNova platform after signup. The trial lasts 30 days and requires a card. Review your selected plan for capacity and usage limits. Prepared applications and bespoke reporting are scoped separately.
Start a 30 day trial with your own spreadsheet, or book a demo to talk through the workflow.
Card required at signup. No charge until your 30 day trial ends. See pricing and trial details.