

Aurelia: a business application in action
Explore reporting, financial evidence, custom models and email briefings in one connected business application.
8:58 · Product walkthroughDemonstration data and modelled examples. Results shown are not achieved customer results.
Video transcript (automatic)
Every business has reports. The opportunity is to connect them to the decisions people need to make. At DataNova, we develop bespoke data, reporting, and intelligence platforms around your business. Aurelia is a working example using demonstration data. We will follow a question from the executive dashboard through financial evidence and custom machine learning to a briefing delivered by email. Revenue is $165.9 million, up 3.9%. That is a positive result. But gross profit has slipped. Gross margin is down more than one percentage point and revenue is below budget. More sales are coming through, but less of each sales dollar is becoming gross profit. That gives leadership a clear question. Where is the pressure and what deserves attention first? The supporting reports let us explore the question across sales, customers, products, purchasing, and operations. We can compare periods and investigate the available business dimensions. This is the value of a connected reporting application. The headline provides direction, and the supporting detail helps the team decide where to investigate. Finance reporting brings together profit and loss, the balance sheet, and the supporting ledger. The period, currency, and reporting scope stay visible so the team can understand what the figures represent before moving into the analyst's explanation. The financial views give leadership a common point of reference for the meeting. A movement can be discussed in the context of the statement, then followed into its supporting detail. The scope stays part of the conversation. The CFO analyst brings in the financial ledger perspective, which has a different reporting basis from the commercial sales view. Financial revenue is down 15.4%. Operating expenses have reduced by 7.6%. Costs are falling, but more slowly than revenue. The analyst turns these calculated measures into findings, priorities, and questions for management. We can follow a finding into a reconciled account movement, then into the supporting ledger in journal detail. The nine account revenue bridge also shows a zero reconciliation difference. That helps the team connect the total movement to the individual accounts contributing to it. The discussion becomes more focused. Which accounts moved? How much did they contribute? And what should the responsible manager investigate? Here, the complete five-line journal has matching debit and credit totals. That gives finance a practical route from explanation to evidence. Meeting view brings the discussion together for leadership. The key movements, investigation points, and management questions are presented in a format the room can work through. We can move from reviewing performance to agreeing the next action, then return to the detail when someone needs supporting evidence. the application becomes part of the management conversation. Budget versus actual reporting shows where performance differs from plan. For client deployments, we can also develop budget submissions, revised forecasts, operational updates, approvals, and locked versions. These are bespoke workflows designed around the client's controls, connecting people contributing information with management reviewing the result. Decision Studio takes us into the separate Atlas demonstration business shown in pounds. Now the question changes. What might happen next? What options do we have? And how should we prepare? The demand forecast uses a custom gradient-boosted machine learning model tested against a seasonal benchmark. 13 historical weeks were held back from training to assess performance on unseen data. At company level, weighted weekly forecast error was 3.29%, compared with 3.63% for the benchmark. Detailed product and site forecasts have greater uncertainty, so the level of the comparison matters. The future view extends the planning horizon by 12 weeks. This gives the team a tested basis for planning, with uncertainty visible alongside the forecast. We can develop models around the client's priorities, including revenue or cash forecasting, renewal risk, and scenario analysis, where the data supports them. We define the decision, test the model, and agree how its output will be used in the business. The forecast becomes more useful when we connect it to an operational choice. Under expected demand, the balanced stock policy models around 309,000 pounds of additional warehouse contribution and 1.46 million pounds of additional cash compared with the current policy. The held-out replay gives a more restrained result, around 133,000 pounds of additional contribution and 1.06 million pounds of additional cash. Under high demand stress, the balanced policy loses ground. A more resilient policy protects service better in the replay but commits substantially more cash. These are conditional scenarios. They help management weigh service, stock, and cash before choosing a policy and identify the assumptions to monitor afterwards. Manpower planning connects workload to capacity. At the baseline, the plan identifies no additional hires. At 1.75 times the workload, it identifies five hires with some early hours still uncovered. That prompts a better discussion than a headline headcount alone. Where is the gap? When does it occur? And what mix of hiring, overtime, or temporary cover should be considered? The site view makes the timing practical. Management can inspect where cover is needed and compare the staffing response before committing to a change. Pricing is another decision where the quality of the evidence matters. This experiment shows a possible improvement, but the uncertainty is too wide to establish a reliable gain. The current recommendation is to hold the rollout. A useful intelligence platform helps the team recognize both an opportunity and the point where more evidence is needed. The AI-assisted briefing brings the findings into plain language. What is positive? What needs attention? What actions to consider? And what to monitor next? In this demonstration, generated commentary is matched to the supporting data and scenario evidence. That connection matters. The insight should help someone act on the analysis and find the evidence when they need to check it. The briefing can reach the person who needs it by email. This demonstration has a weekday executive briefing configured and a test has already been received and approved. The email presents the important findings in a readable form with a route back into the application. The recipient can start with a summary and follow the detail where a decision needs more attention. For clients, this can become a morning briefing about the previous 24 hours, a weekly review of the important movements, or an alert when an agreed condition is met, margin pressure, spending beyond tolerance, or a forecast stock shortfall. The reporting period, source context, and delivery setup are visible. For a client solution, we agree how data is updated, how often analysis runs, and when people receive an update. Clear timing helps recipients understand the evidence behind each briefing. We tailor the measures, recipients, timing, and escalation rules around the business. The update should explain what changed, why it matters, whether it is positive or negative, and what to investigate or monitor next. This is proactive intelligence, bringing a focused, evidence-backed update to the people who need to make a decision. The experience can be shaped around the people using it, including clear light and dark presentation. Aurelia demonstrates what is possible. For your business, we build around your data, your processes, and your decisions, from the first input screen to the next management action.
Explore this capabilitySee another workflow.
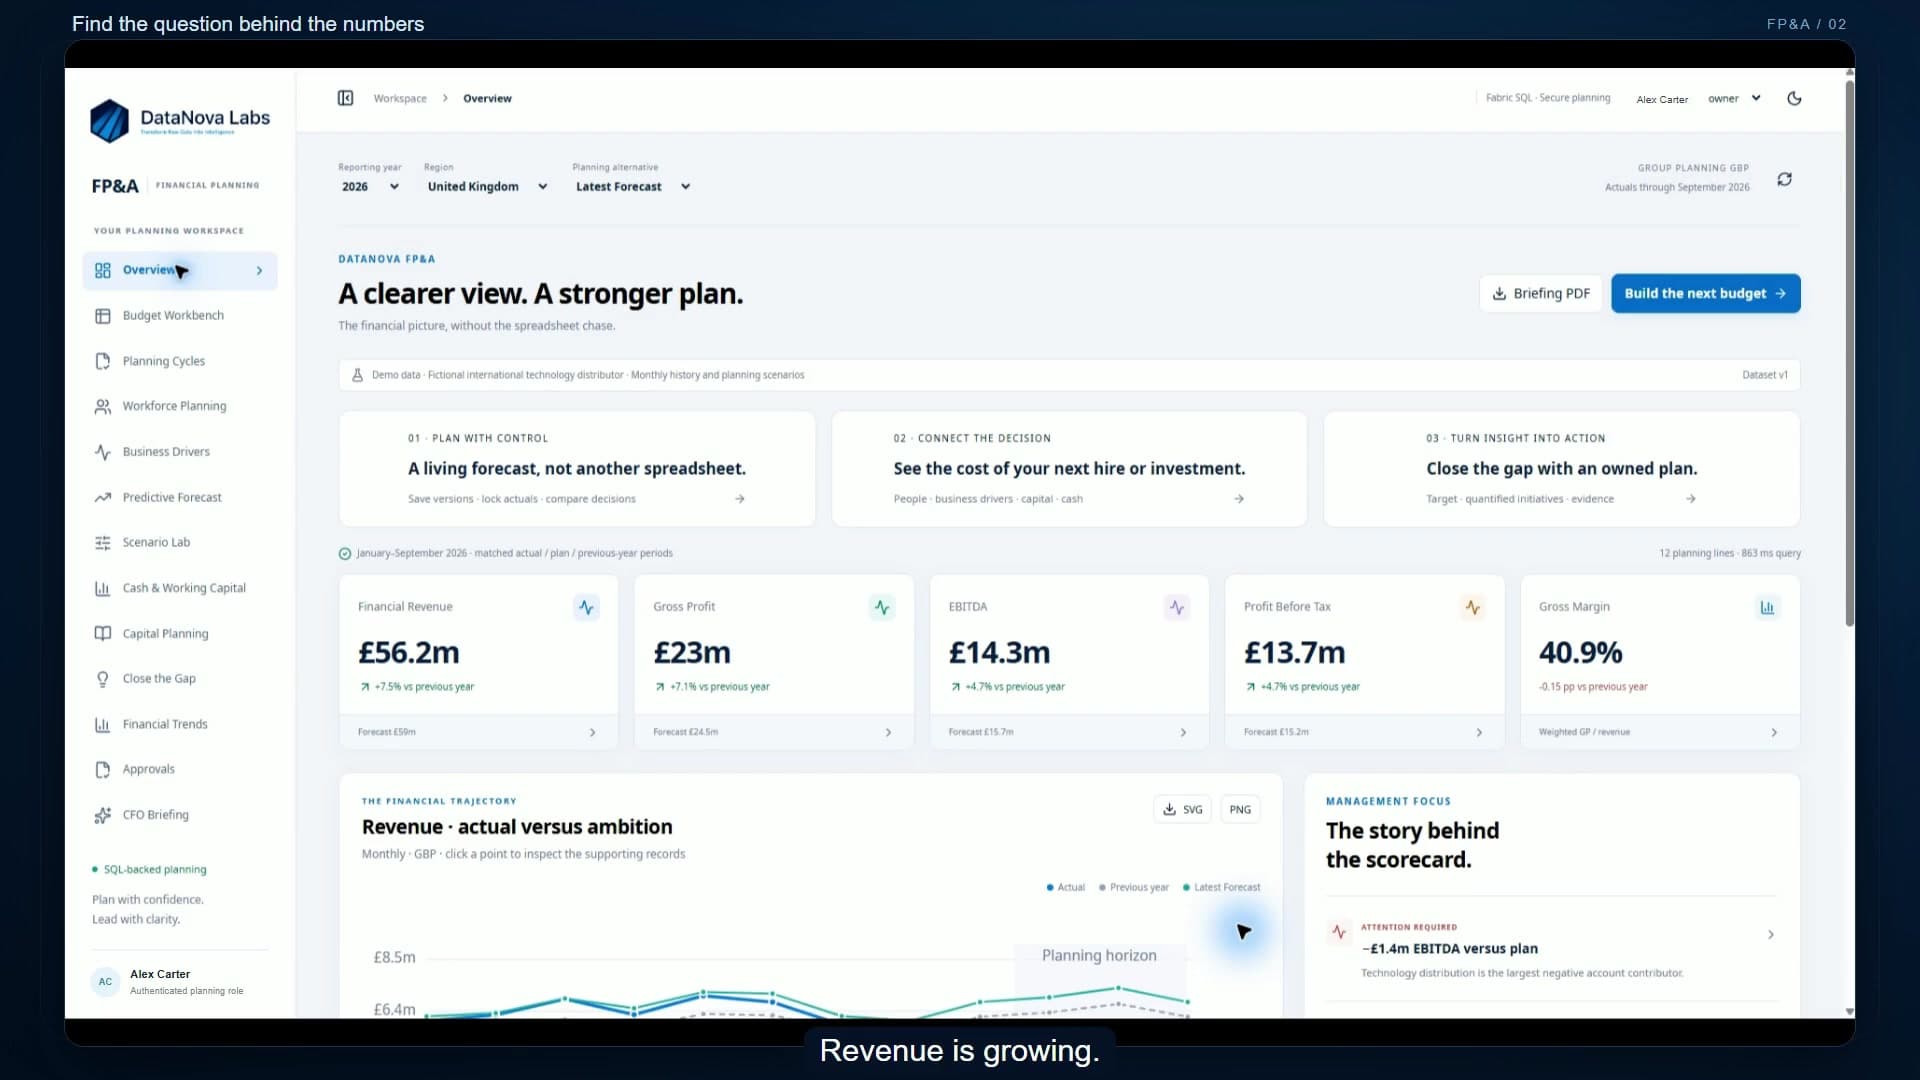 8:34
FP&A: from performance to a plan
Follow a performance gap into budgeting, rolling forecasts, workforce costs, cash planning and approval workflows.
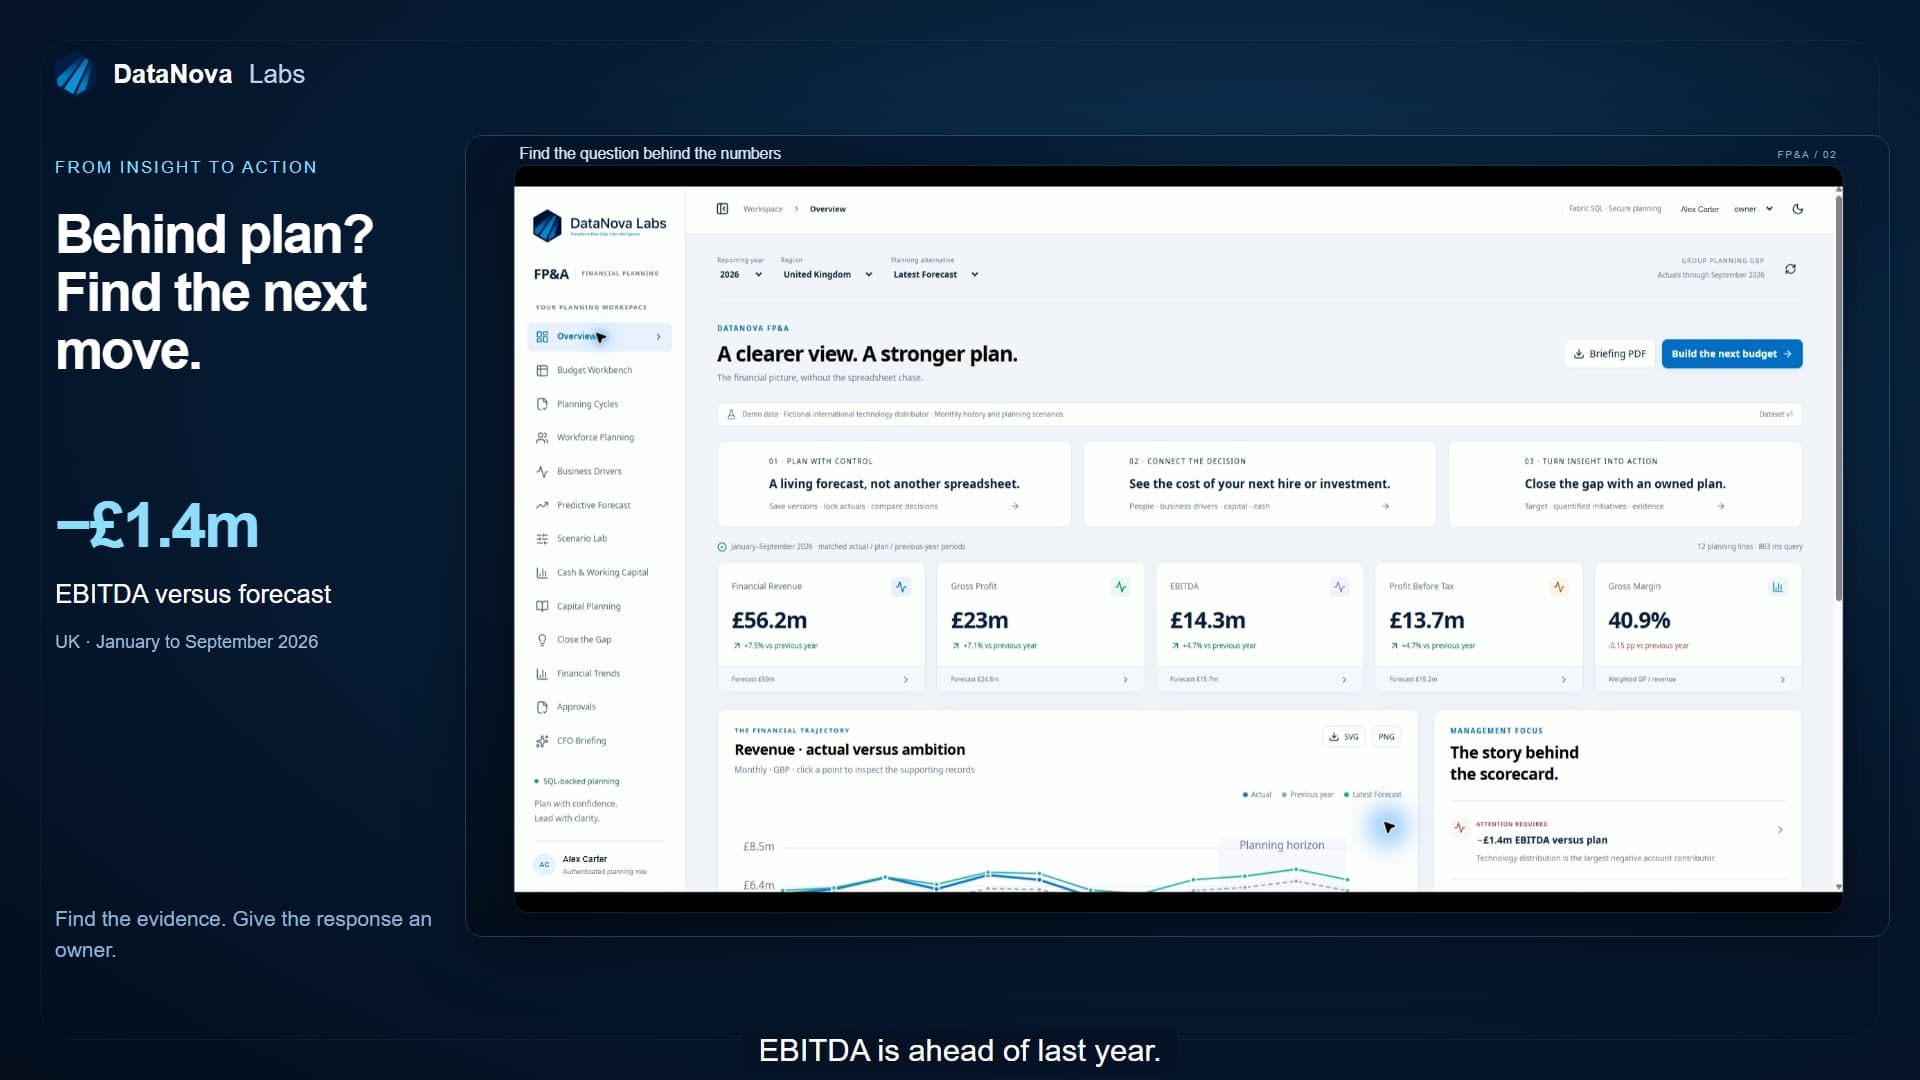 0:41
From the performance gap to the next action
Follow an EBITDA gap into its supporting accounts, then connect the response to initiatives and accountable owners.
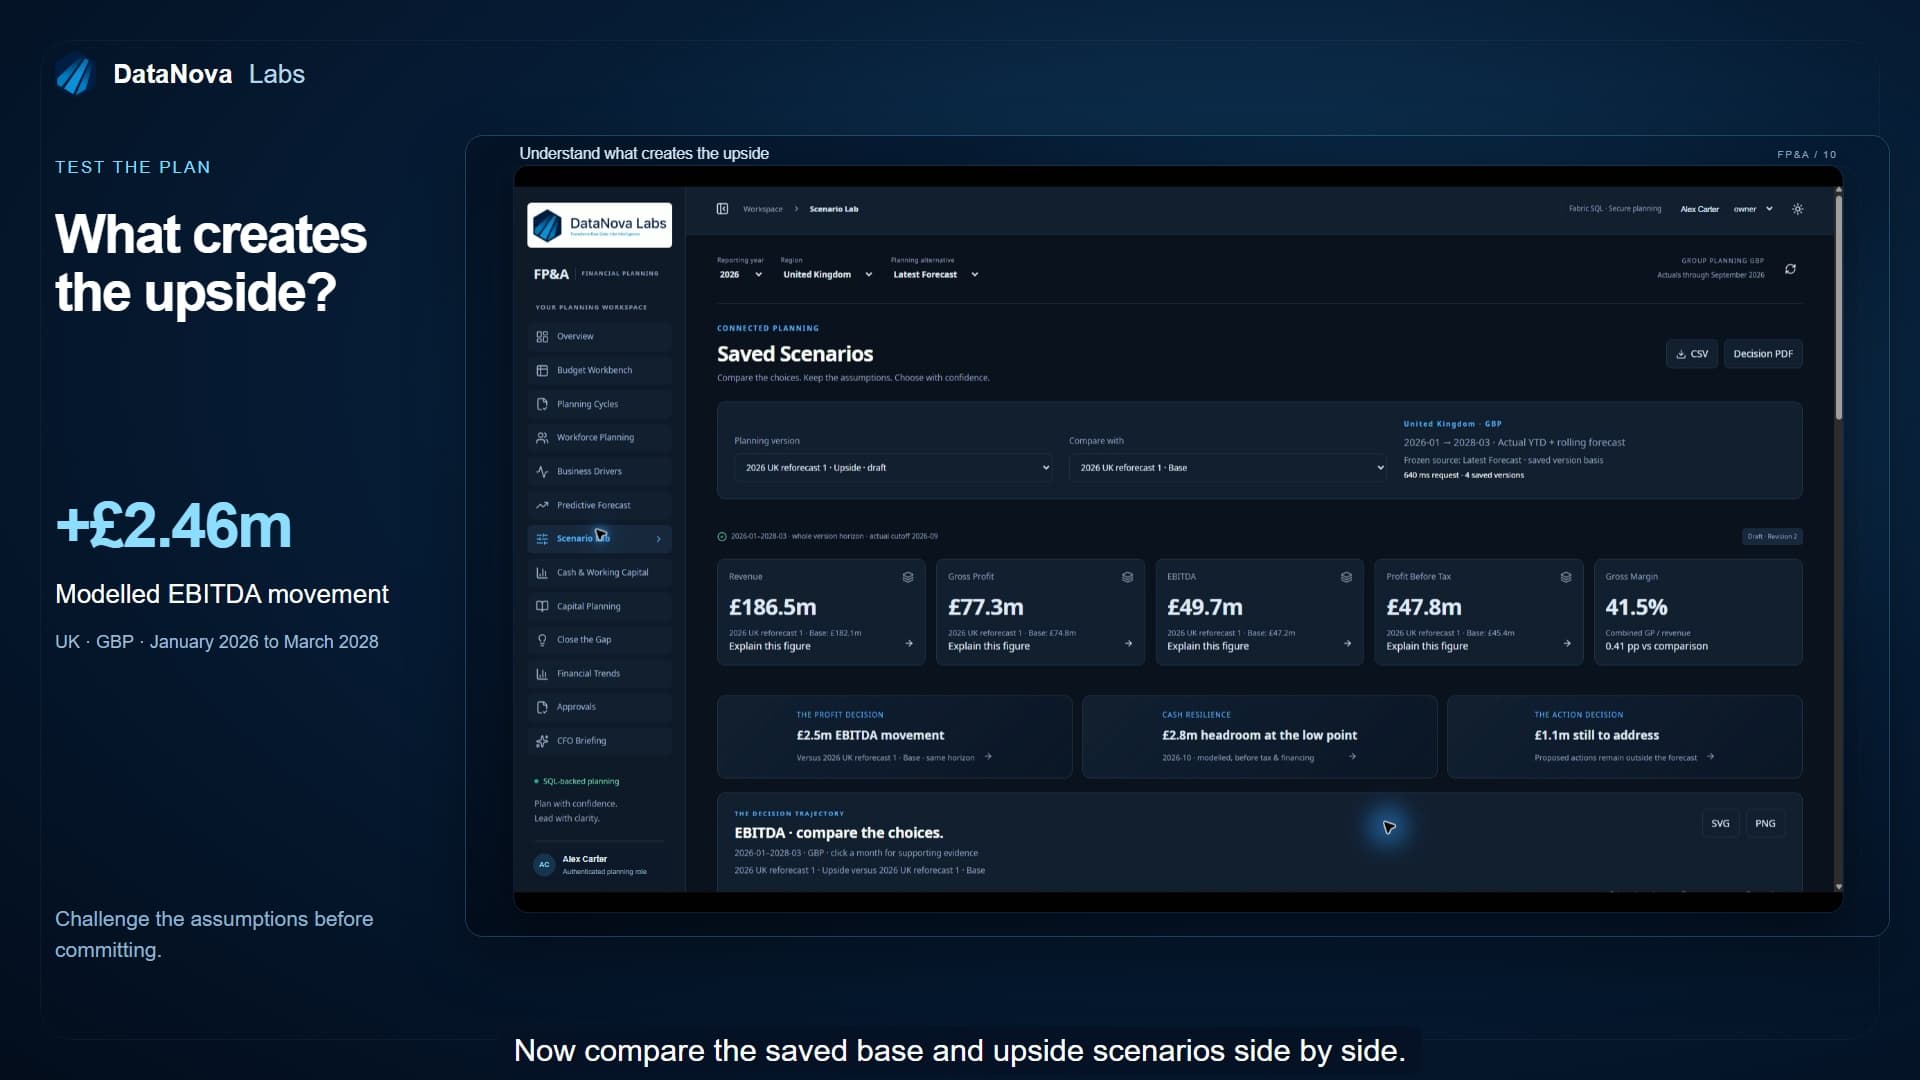 0:39
Compare scenarios and explain the difference
Compare a base plan with an upside scenario and inspect the account movements behind the modelled result.