

Spreadsheet upload & reporting
Upload your workbook, choose the data to process and follow it into reporting.
2:47 · Product walkthroughDemonstration data and modelled examples. Results shown are not achieved customer results.
Video transcript (automatic)
Before a spreadsheet is ready for reporting, there's usually a fair bit of work to do, and that's the challenge we see all the time. Checking the files. Correcting errors. Making sure the latest figures don't overwrite the history you still need. Let me show you how we bring that process together, from uploading a workbook to exploring the results in a report. Here, we're uploading one Excel workbook containing five datasets, US sales, UK sales, EU sales, budget, and forecast. Every worksheet is detected automatically, and we can choose exactly what to process. We'll take all five. As the upload runs, the files are validated, scanned for security, checked for duplicate records, and standardized before the data goes any further. And this is where it gets more interesting. The platform analyzes the columns, data types, and schema of each sheet, then checks whether a structurally similar table already exists. If it finds a match, we can append the new records to the existing dataset. That's particularly useful for recurring data like budgets and forecasts. Instead of overwriting the previous version, each revision can be retained historically and compared against earlier budgets, forecasts, and actuals. For this demonstration, we'll create new datasets and let the pipeline continue. The ETL now runs automatically : Validation and Cleaning, Metadata Extraction, Parquet Conversion, Lakehouse Update, Semantic Model Refresh, and Power BI Refresh. What started as a spreadsheet is now structured, reusable data. Once the data is available, a Power BI report can be created automatically, giving users an immediate starting point for analysis. What we're showing next is a separate, more developed report example. It's an interactive reporting environment designed to run meetings, moving from executive KPIs into regions, products, locations, budgets, forecasts, and transaction-level detail. But spreadsheets are only one part of the picture. We can combine them with CRM, Finance, ERP, and Operational systems, bringing everything into one connected data platform. So you can follow a lead from the CRM, through the sale, into the general ledger, and ultimately to the cash received in the bank, with one joined-up view of the entire journey. The result is one governed source of truth across the business, ready for reporting, forecasting, and AI-powered analysis. If any of this looks familiar, and you'd like to see what DataNova could do with your data, get in touch.
Explore this capabilitySee another workflow.
 2:02
AI conversational analyst
Ask a business question in plain English, inspect the answer and follow up in the same conversation.
 8:34
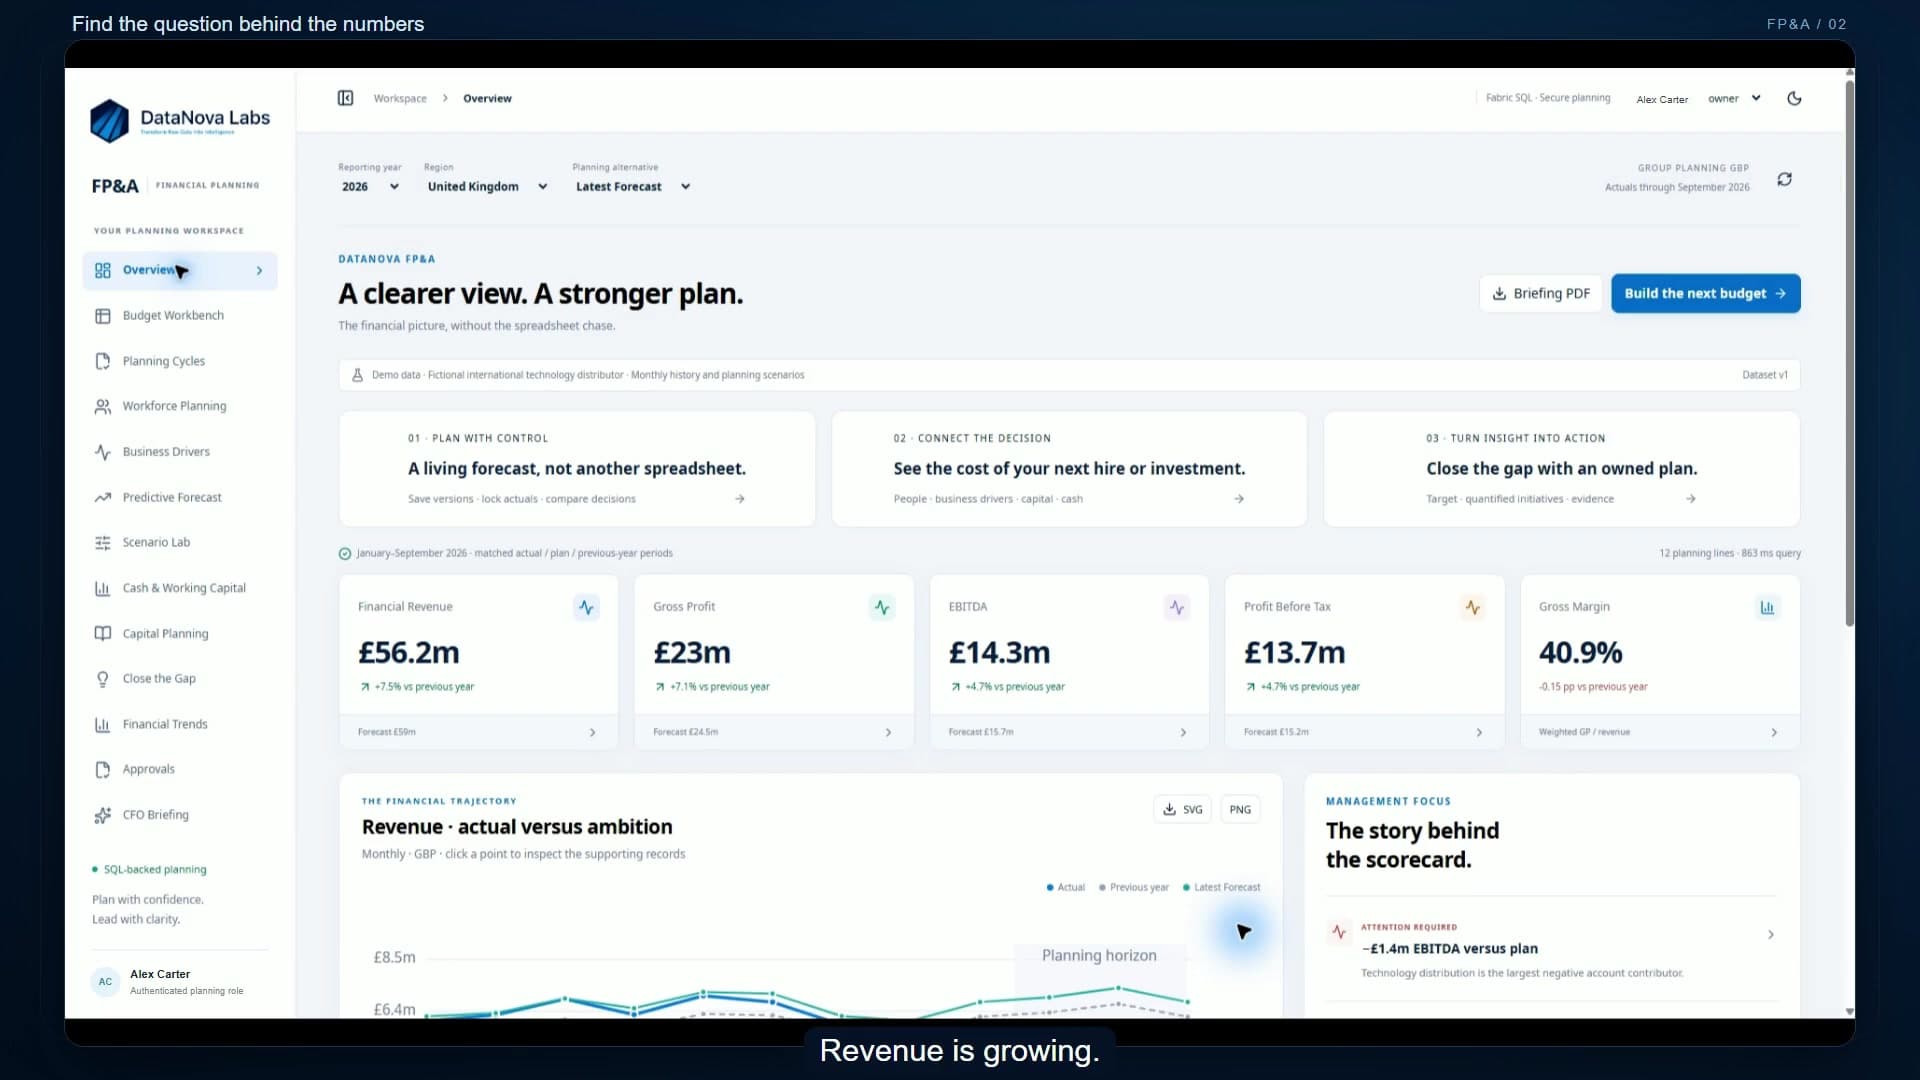
FP&A: from performance to a plan
Follow a performance gap into budgeting, rolling forecasts, workforce costs, cash planning and approval workflows.
 8:58
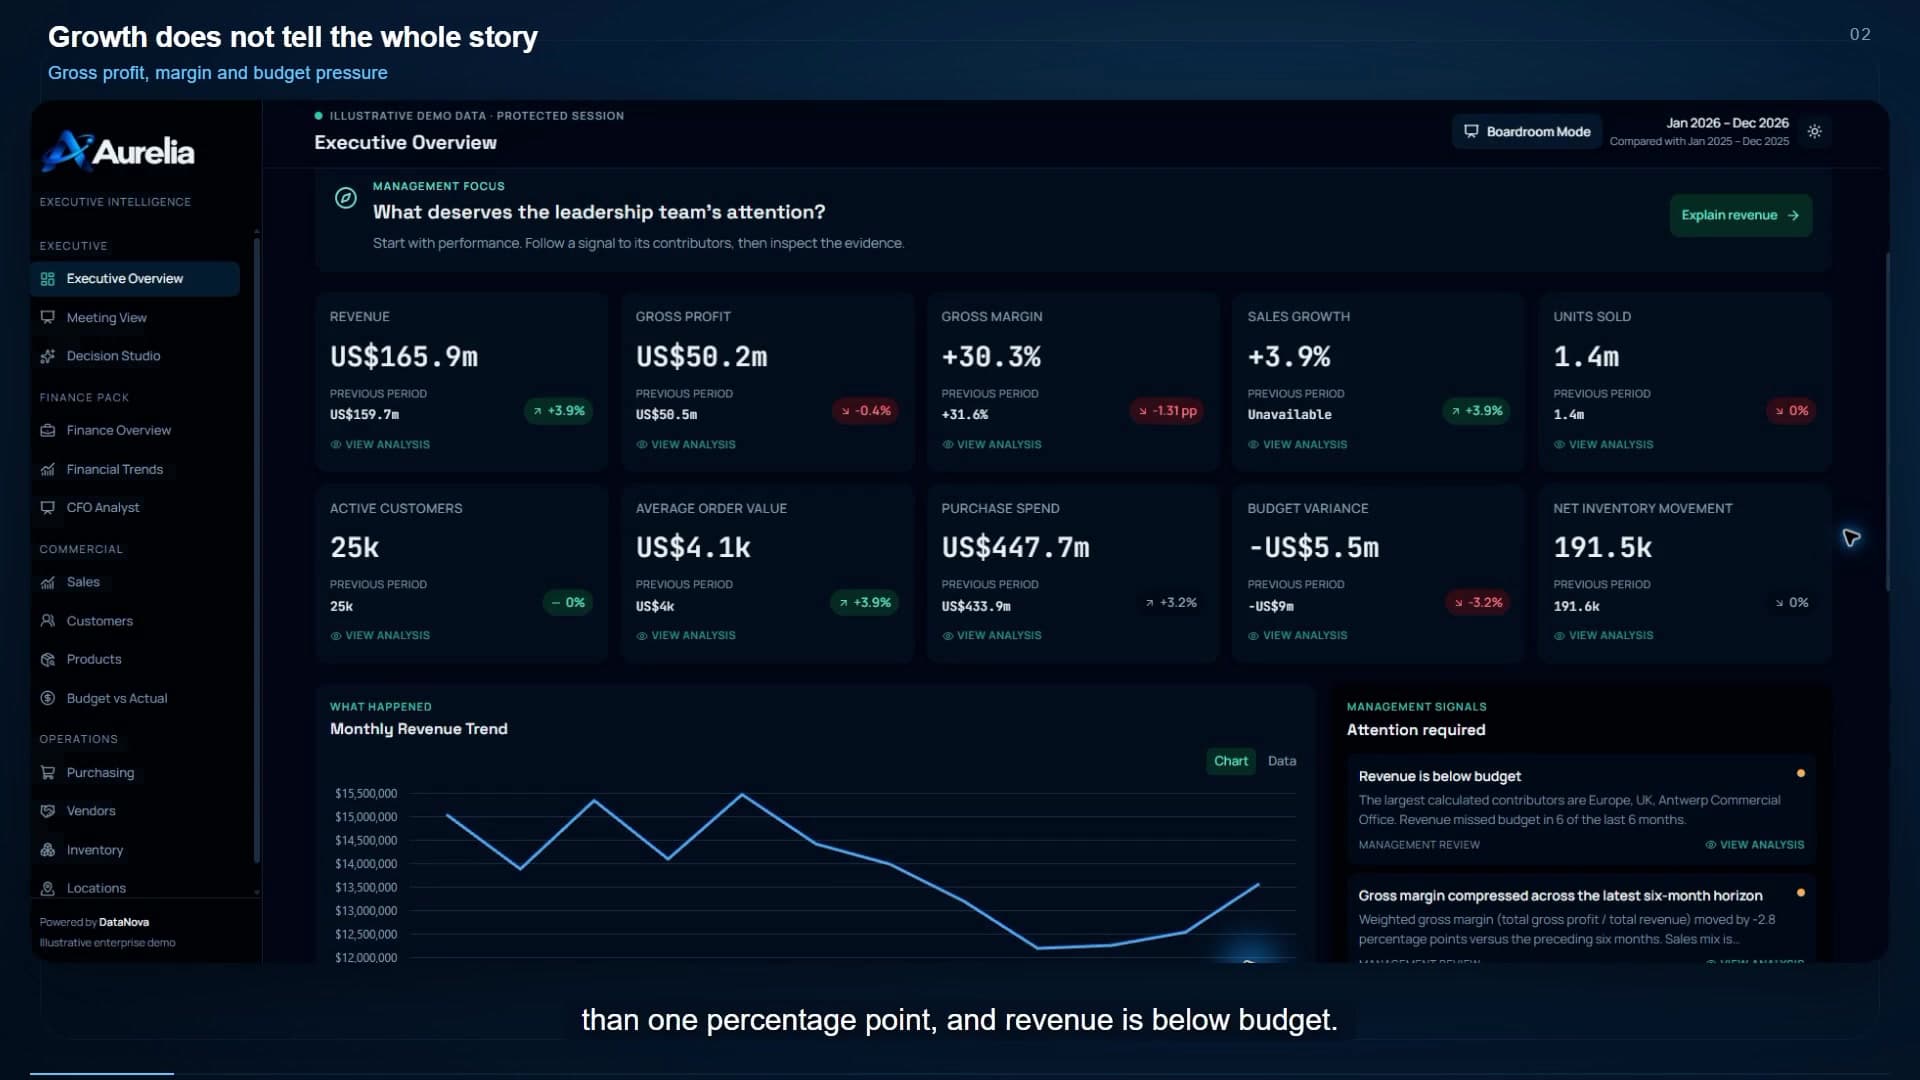
Aurelia: a business application in action
Explore reporting, financial evidence, custom models and email briefings in one connected business application.