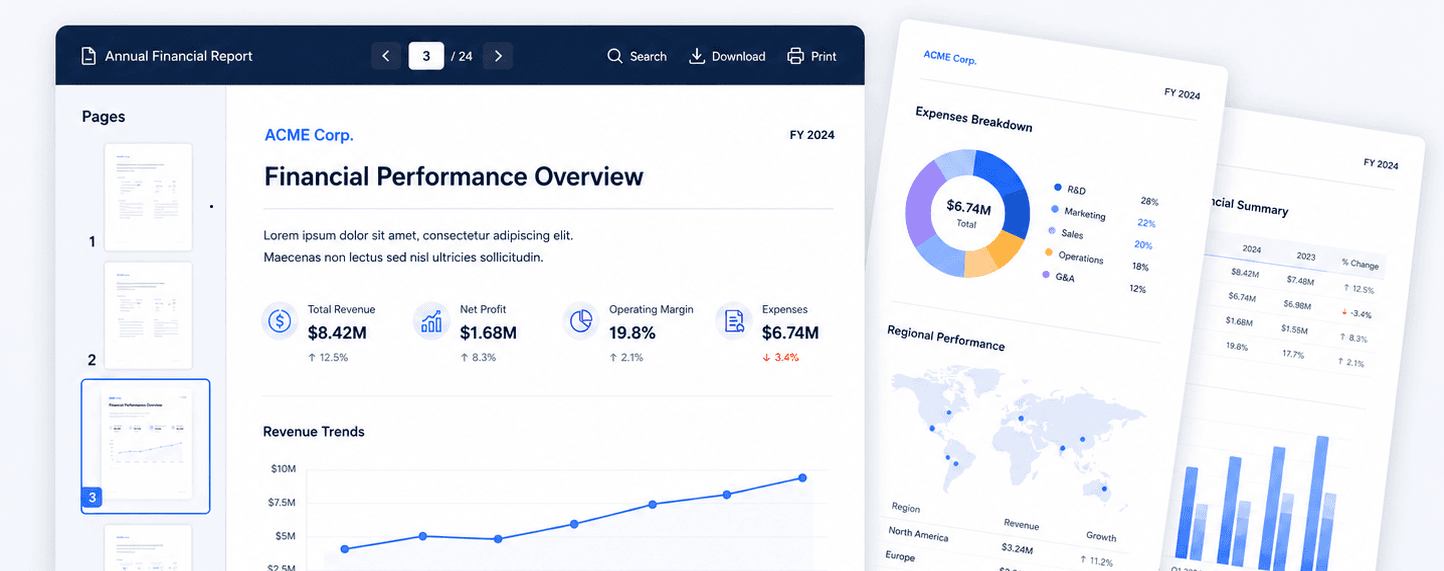



Dashboards are useful, but they still require interpretation.
A user may see that revenue has dropped, margin has changed, or performance is behind target. But the next question is usually: why?
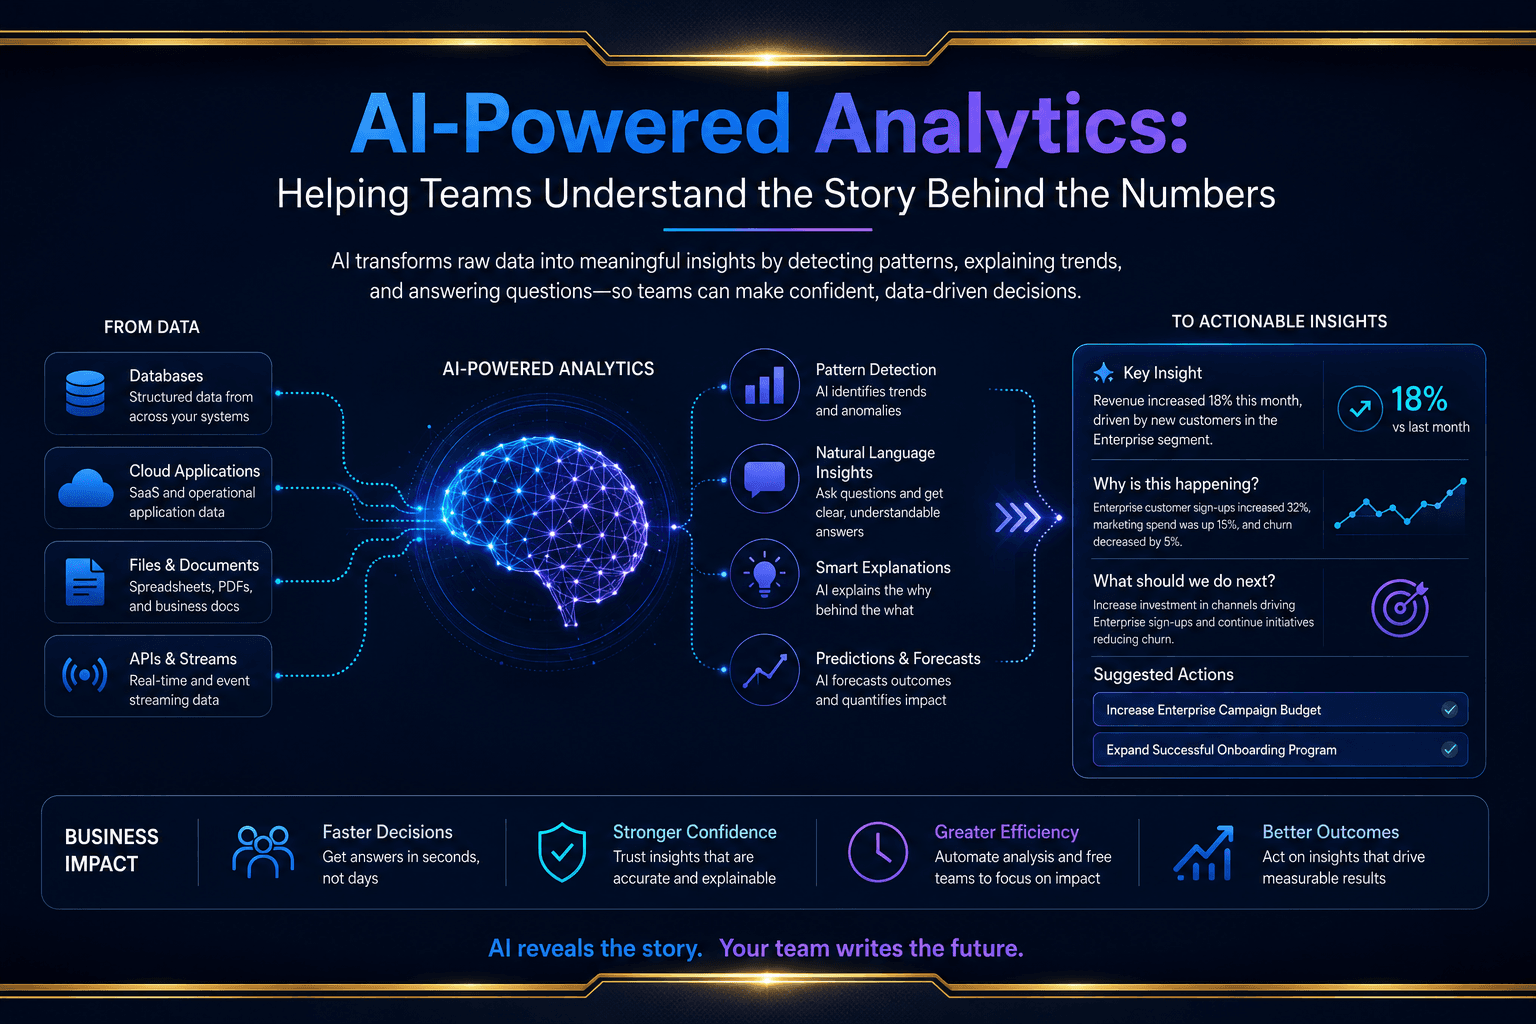
AI-powered analytics can help bridge the gap between seeing data and understanding it.
Instead of only presenting charts, tables, and KPIs, AI can assist users by generating summaries, explanations, and narratives based on governed reporting data.
This can help teams understand:
- What changed
- Which KPIs need attention
- Which areas are performing strongly
- What may be driving a trend
- Where users should investigate further
- How current performance compares to previous periods
For example, rather than simply showing a sales dashboard, AI assistance can summarise key movements, highlight changes by region or product, and explain where performance has improved or declined.
However, AI in analytics must be controlled.
Allowing AI tools to interact freely with raw databases can create security, accuracy, and governance risks. Business users need answers they can trust, based on controlled definitions and approved reporting logic.
DataNova’s approach is based on governed AI access. AI tools interact with structured semantic models rather than unrestricted raw data sources. This means insights can be aligned to existing business definitions, report logic, and access permissions.
The goal is not to replace dashboards.
The goal is to make dashboards easier to understand.
With AI-assisted analytics, users can move faster from data to decision. They can spend less time interpreting charts and more time acting on the insights.
For modern businesses, this creates a more accessible reporting experience where users do not just see the numbers - they understand the story behind them.