



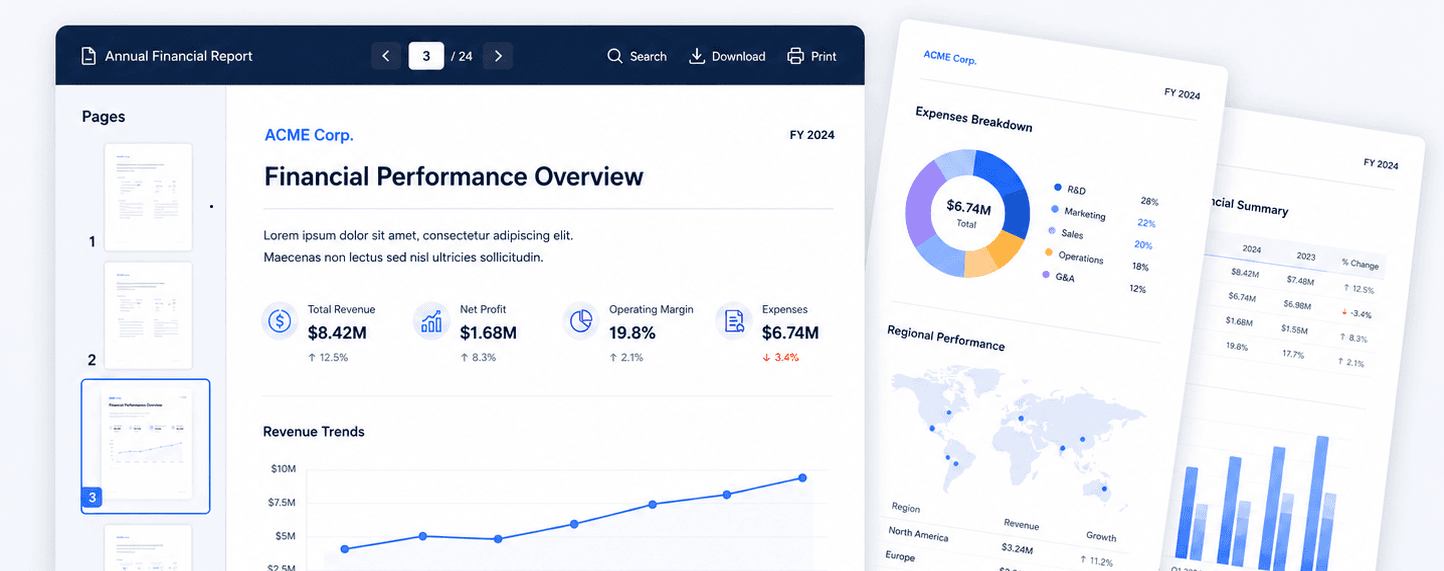
Dashboards are powerful for exploring data, tracking KPIs, and spotting trends. But not every business report is designed to be interactive.
Sometimes, organisations need reports that are structured, formatted, printable, and repeatable. This is where paginated reports become valuable.
Paginated reports are designed for fixed-format reporting. They are ideal when a business needs reports that can be exported, printed, shared, or distributed in a consistent layout every time.
Common use cases include:
- Financial statements
- Board reporting packs
- Invoices and statements
- Compliance reports
- Operational exports
- Customer-level reports
- Detailed transaction listings
While dashboards help users explore information visually, paginated reports are built for precision. They allow organisations to present data in a controlled format with page breaks, tables, headers, footers, and export-ready layouts.
For many businesses, the best approach is not dashboards or paginated reports. It is both.
A leadership team may need live dashboards to monitor performance throughout the month, while finance teams may still need formal monthly packs. Operations teams may need dashboards for daily monitoring, but also structured exports for audit, compliance, or customer reporting.
DataNova supports this mixed reporting model by helping organisations bring data into a governed platform, build trusted semantic models, and deliver reporting outputs that match the needs of different users.
Dashboards give teams visibility. Paginated reports give teams structure.
Together, they help organisations move from fragmented reporting to a more complete, governed analytics environment.