



A dashboard should do more than look good.
A great business dashboard helps users understand performance, identify issues, and make better decisions faster.
Many dashboards fail because they try to show too much. They include too many charts, unclear KPIs, inconsistent definitions, or visuals that look impressive but do not answer meaningful business questions.
The best dashboards are built around clarity.
They help users answer questions such as:
- Are we on track?
- What has changed?
- Where are the risks?
- Which areas need attention?
- What should we do next?
Good dashboards usually start with the user.
An executive dashboard should not look the same as an operational dashboard. Leadership teams need high-level KPIs, trends, and exceptions. Operational users may need detailed filters, drill-throughs, and daily activity monitoring.
A strong dashboard should include:
- Clear KPIs
- Consistent definitions
- Simple visual design
- Useful filters
- Relevant comparisons
- Trend visibility
- Drill-through where needed
- Trusted underlying data
But dashboard design is only one part of the solution.
A dashboard is only as reliable as the data model behind it. If the same KPI is calculated differently by different teams, users will lose trust. If data is manually copied between spreadsheets, errors can appear. If reports are disconnected, decision-making becomes slower.
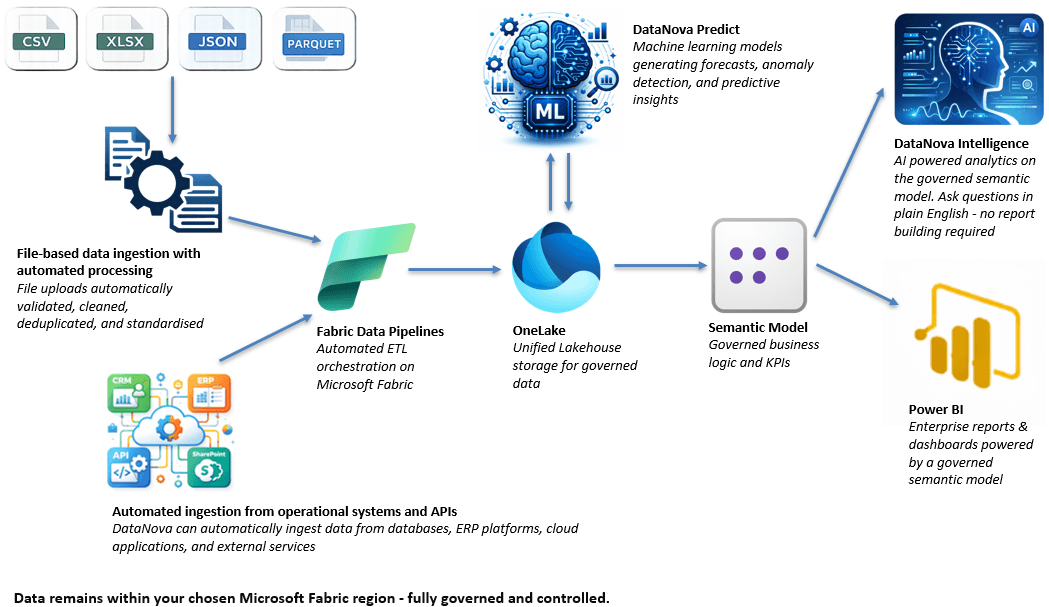
DataNova helps businesses build dashboards on a governed reporting foundation.
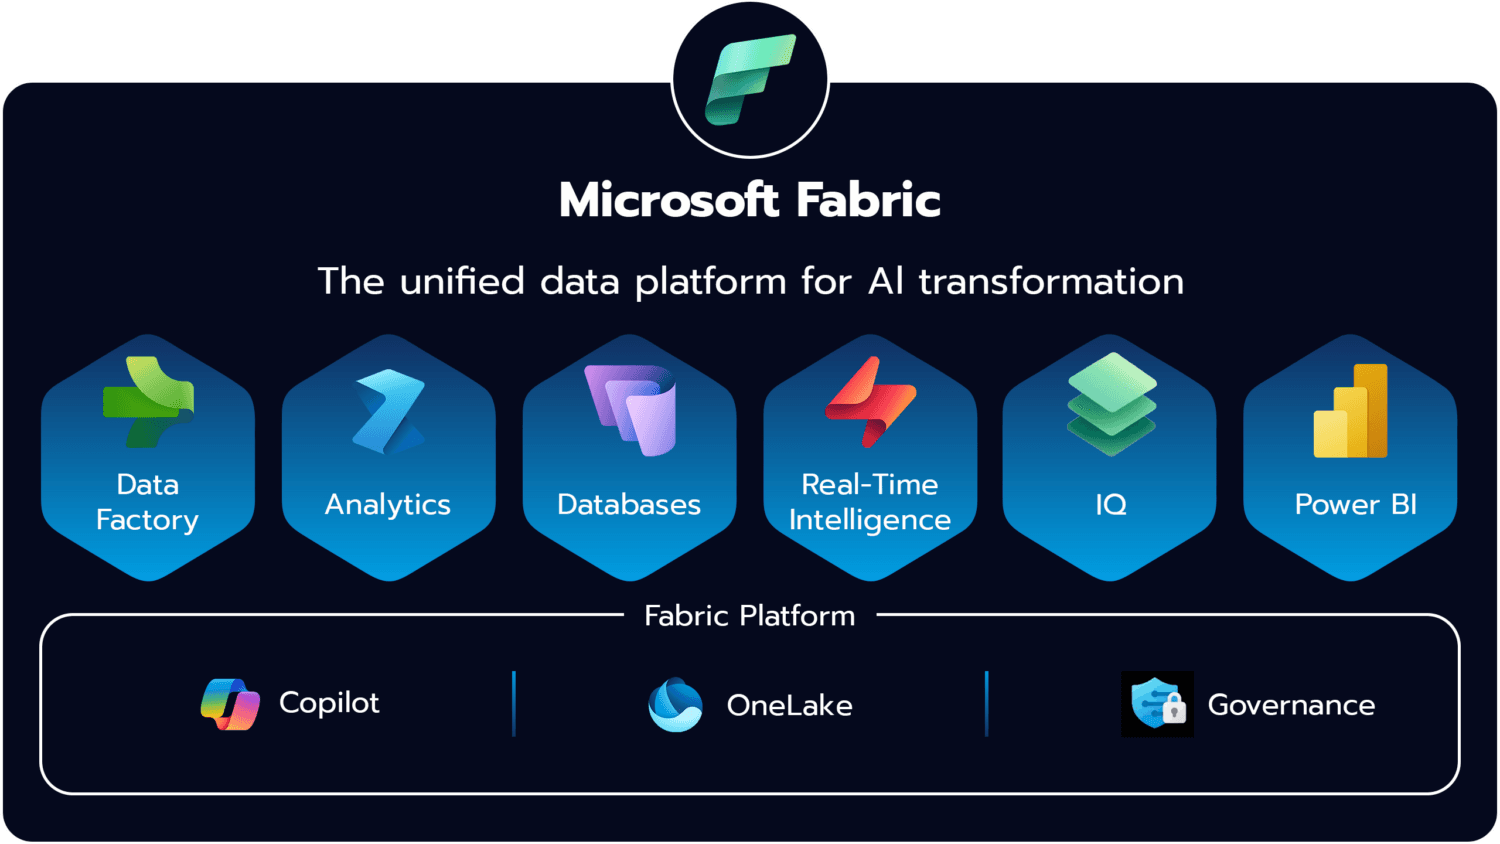
By connecting spreadsheets, business systems, databases, and APIs into Microsoft Fabric, DataNova creates the structured data layer needed for consistent Power BI reporting.
This means users do not just get attractive dashboards. They get dashboards built on trusted data, governed semantic models, and automated pipelines.
A great dashboard is not just a visual layer.
It is the final result of a reliable data process.