


Salesforce is a powerful CRM platform, but many businesses still need more flexible reporting across sales, finance, marketing, and operations.
Sales teams may track opportunities in Salesforce, but leadership often wants a wider view. They may need to combine pipeline data with invoicing, targets, marketing activity, customer success metrics, or financial performance.
This is where Power BI can add significant value.
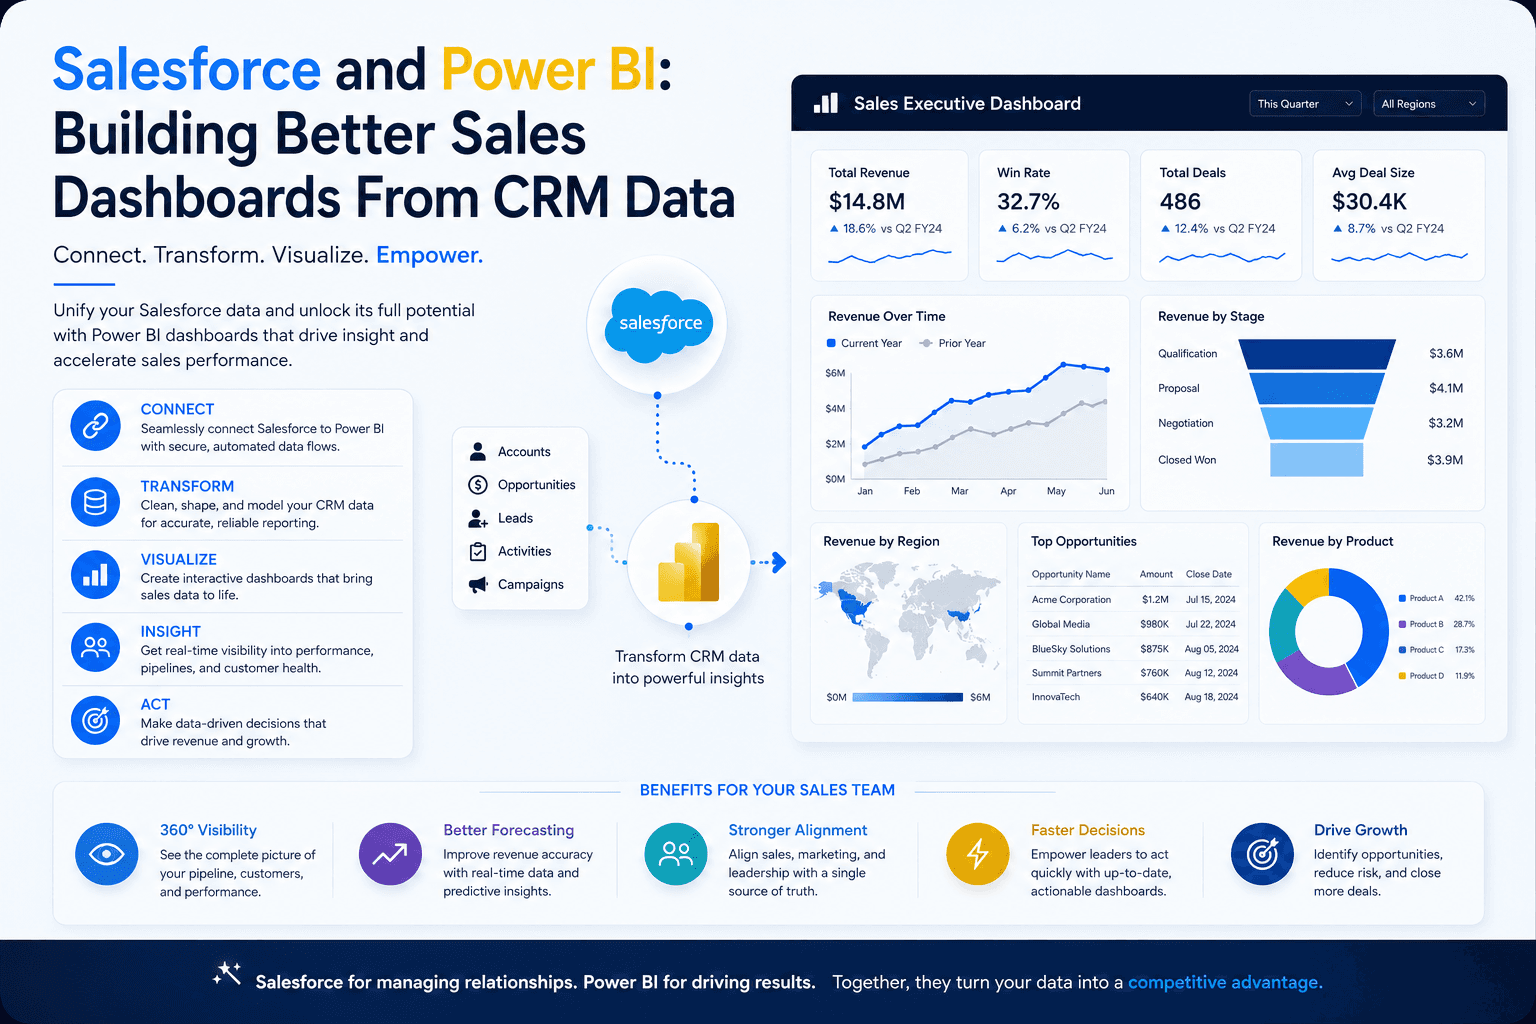
By connecting Salesforce data to Power BI, organisations can create dashboards that go beyond standard CRM reporting and provide clearer insight across the business.
Common Salesforce and Power BI reporting use cases include:
- Sales pipeline dashboards
- Revenue forecasting
- Opportunity conversion analysis
- Sales rep performance
- Customer segmentation
- Win/loss reporting
- Campaign performance
- Executive sales dashboards
- Forecast vs actual reporting
The real value comes when Salesforce data is combined with other business sources.
For example, a company may want to compare CRM pipeline against actual revenue from an ERP system. It may want to combine marketing leads with closed deals. It may want to understand customer profitability by linking Salesforce accounts to finance data.
This kind of reporting is difficult when data remains trapped in separate systems.
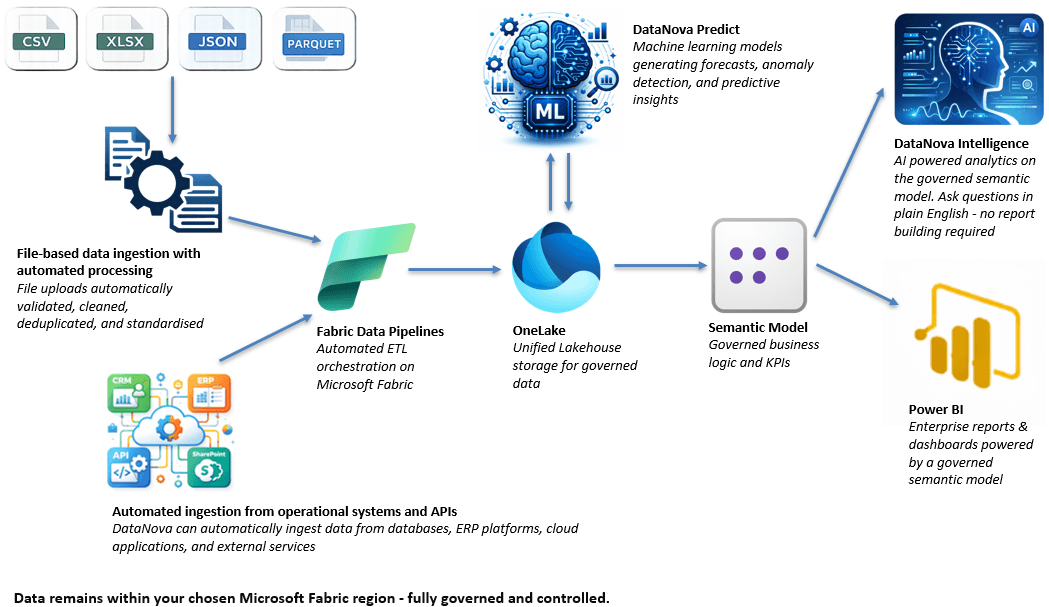
DataNova helps organisations connect Salesforce, spreadsheets, databases, ERP platforms, and APIs into a governed Microsoft Fabric pipeline. From there, the data can be modelled and delivered through Power BI dashboards.
This gives teams a more complete view of customer and sales performance.
Instead of relying only on system-level reports, leadership can access live dashboards that show the metrics that matter most.
Salesforce captures valuable customer and pipeline data. Power BI turns that data into visual insight. DataNova provides the automated data platform that connects, governs, and delivers the reporting experience.
The result is better visibility, stronger forecasting, and more confident sales decision-making.