



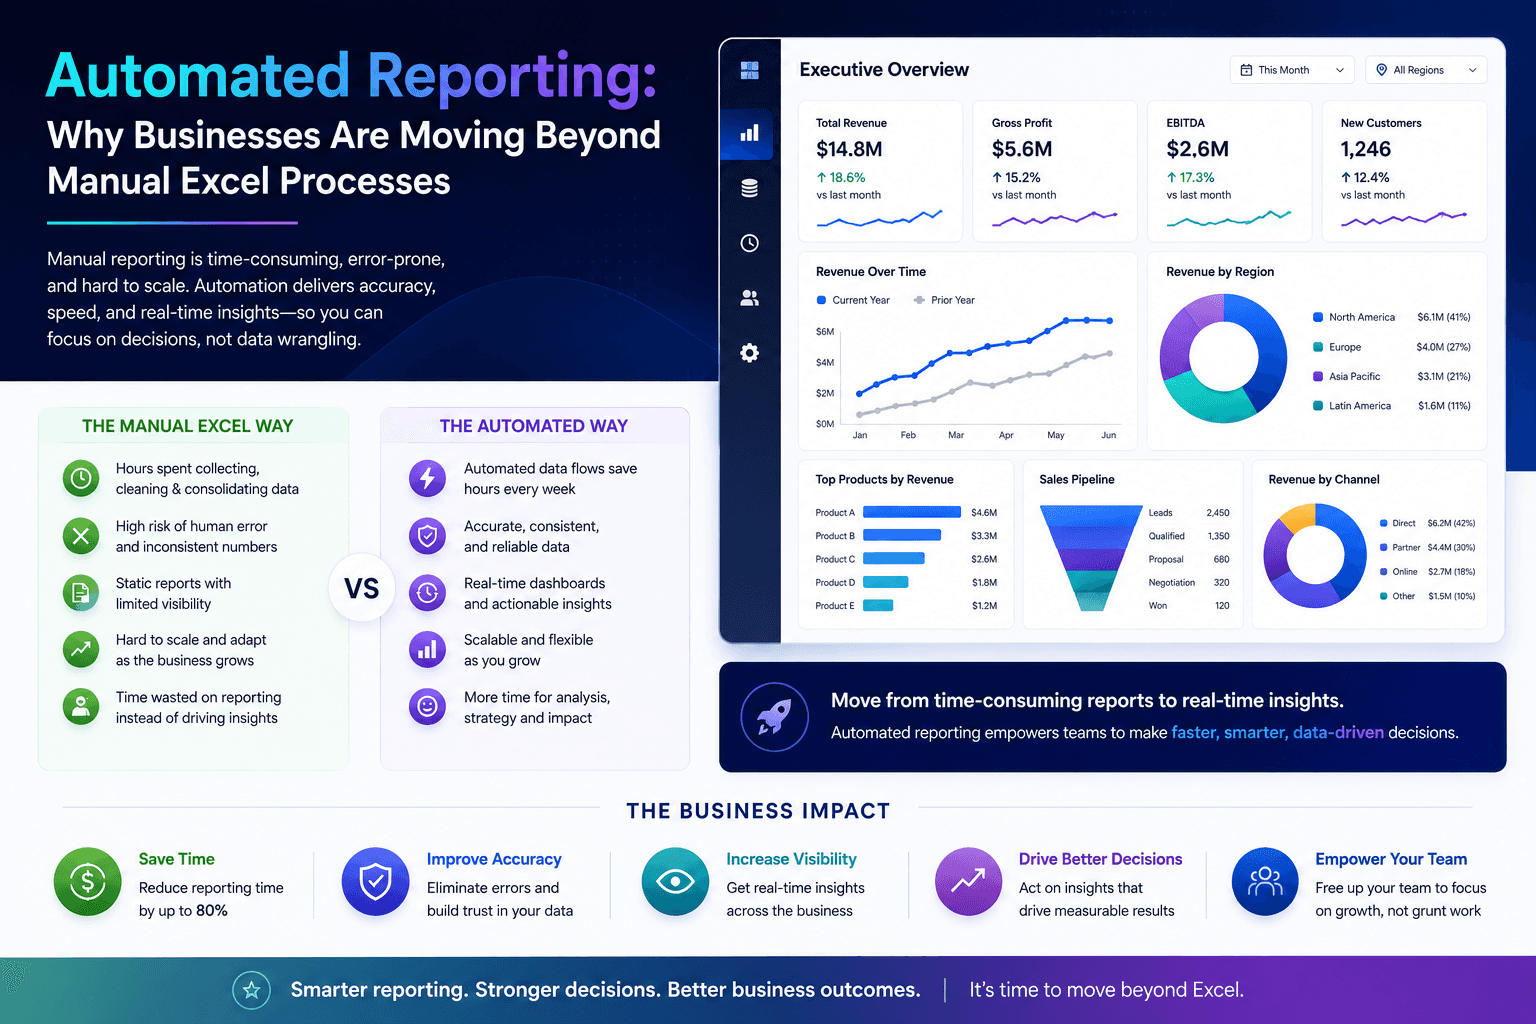
Excel is one of the most useful business tools ever created.
It is flexible, familiar, and powerful. But when organisations rely on manual spreadsheets for core reporting, problems can quickly appear.
Teams often spend hours exporting data, copying figures, updating formulas, checking versions, and rebuilding the same reports every month. Over time, reporting becomes slower, riskier, and harder to trust.
Common problems include:
- Manual copy-and-paste errors
- Multiple versions of the same report
- Slow month-end reporting
- Inconsistent KPI definitions
- Limited auditability
- Heavy dependency on key individuals
- Difficulty combining data from different systems
Automated reporting helps businesses move beyond this cycle.
Instead of manually preparing data every time a report is needed, automated pipelines can collect, transform, and prepare information for reporting. Dashboards can then update from governed data models, giving teams faster access to trusted insights.
This does not mean Excel disappears.
For many businesses, Excel still has an important role. It can be useful for analysis, modelling, planning, and ad hoc work. The issue is when Excel becomes the main reporting infrastructure for the entire organisation.
DataNova helps businesses keep the flexibility they need while reducing the manual work behind recurring reporting.
Our platform connects spreadsheets, CRM systems, ERP platforms, databases, and APIs into a governed Microsoft Fabric pipeline. From there, DataNova delivers live Power BI dashboards and structured reporting outputs.
This gives teams more reliable visibility without needing to rebuild reports manually every month.
Automated reporting helps businesses save time, reduce errors, and improve confidence in the numbers.
The result is simple: less reporting admin, more useful insight, and better decisions across the organisation.