Microsoft Fabric: The Modern Data Platform for Power BI, AI, Data Engineering and Enterprise Analytics
Microsoft Fabric: The Modern Data Platform for Power BI, AI, Data Engineering and Enterprise Analytics
Learn how Microsoft Fabric brings data engineering, data integration, OneLake, Direct Lake, Power BI, AI, machine learning, governance and real-time analytics into one unified platform for modern business reporting.
PH
Pardip Hayer
CategoryMicrosoft Fabric
Suggested Read Time30 Minutes Read
Modern organisations are producing more data than ever before.
Data sits in spreadsheets, CRM systems, ERP platforms, finance systems, operational databases, cloud applications, APIs, data warehouses and legacy reporting tools. For many businesses, the challenge is no longer whether they have enough data. The challenge is bringing that data together in a way that is useful, trusted, secure and ready for decision-making.
This is where Microsoft Fabric becomes important.
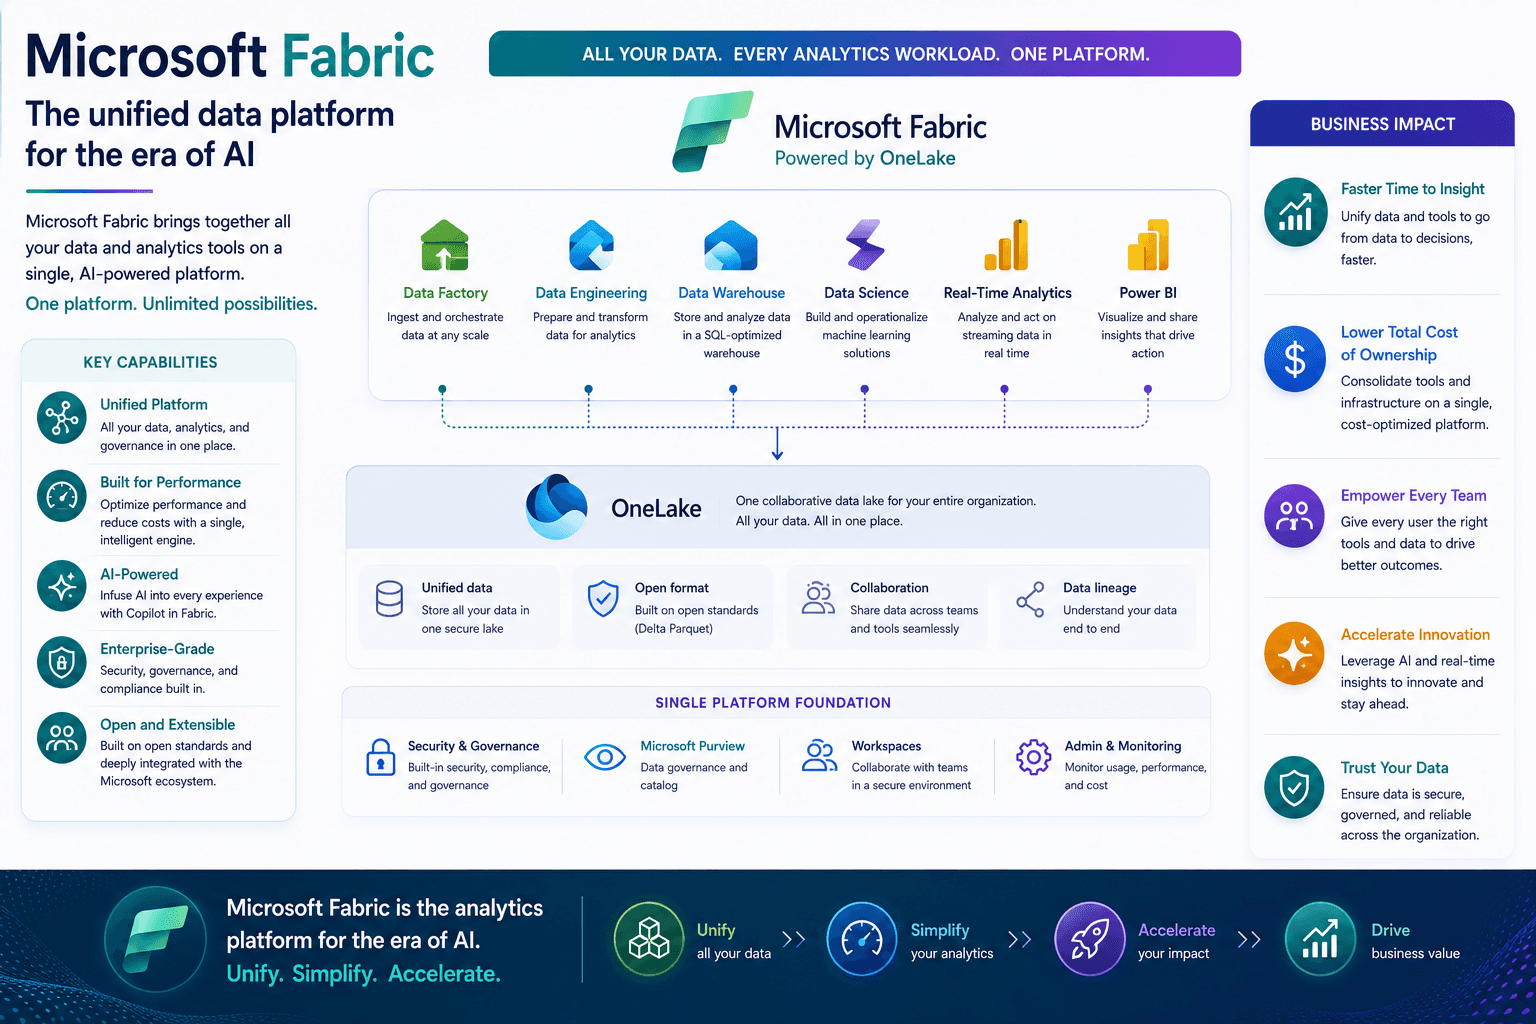
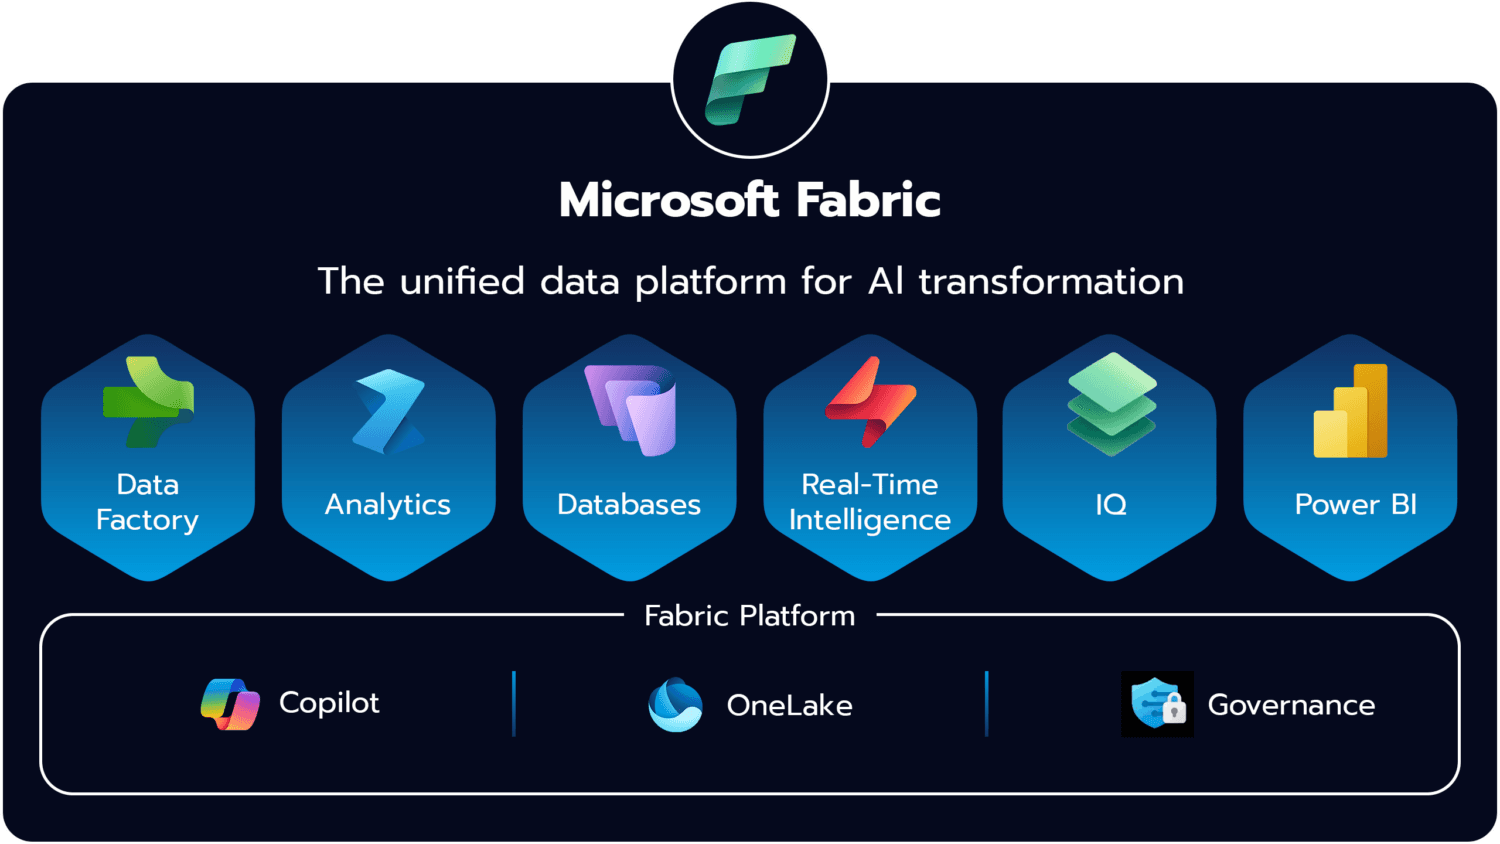
Microsoft Fabric is Microsoft’s unified analytics platform. It brings together data integration, data engineering, data warehousing, data science, real-time analytics and Power BI into one connected environment. Instead of managing separate tools for pipelines, storage, modelling, machine learning and reporting, Fabric gives organisations a single platform for building a modern data foundation. Microsoft describes Fabric as an AI-powered analytics platform that unites data and services across the analytics lifecycle.
For businesses that rely on Power BI reporting, Excel reporting, Dynamics 365 reporting, Salesforce dashboards, finance dashboards, executive dashboards or operational analytics, Microsoft Fabric provides a strong foundation for moving from fragmented data to governed insight.
At DataNova, Microsoft Fabric sits at the heart of our platform approach. We use Fabric to help organisations connect business systems, automate data pipelines, structure data into reporting-ready models and deliver governed Power BI dashboards.
What Is Microsoft Fabric?
Microsoft Fabric is a cloud-based analytics platform designed to bring different data workloads together.
Traditionally, businesses often needed separate services for data integration, data lakes, data engineering, data warehousing, machine learning, real-time analytics and business intelligence. That created complexity. Data had to be copied between tools, teams had to manage separate environments, and reporting often became fragmented.
Microsoft Fabric brings these experiences into one platform.
It supports workloads such as:
Data integration, often used for ETL and ELT pipelines.
Data engineering, used to process, clean and transform data at scale.
Data warehousing, used for structured SQL-based analytics.
Data science, used for machine learning, predictive analytics and advanced modelling.
Stay informed with the latest news, insights, and updates delivered straight to your inbox
Real-time analytics, used for streaming data and near real-time insight.
Power BI, used for dashboards, semantic models, paginated reports and business intelligence.
Copilot in Fabric, used to support AI-assisted development, exploration and analysis.
Microsoft’s own Fabric overview explains that OneLake is the centralised logical data lake for Fabric, and that Fabric workloads can store and access data through OneLake.
In plain English, Fabric helps businesses move towards one connected analytics environment instead of many disconnected reporting tools.
Why Microsoft Fabric Matters for Business Reporting
Many organisations still rely on manual reporting processes.
Finance teams export data from ERP systems into spreadsheets. Sales teams manually download CRM reports.
Operations teams maintain separate trackers. Leadership receives static reports that may already be out of date by the time they are reviewed.
This creates several common problems:
Reports take too long to produce.
Teams do not trust the numbers.
Different departments use different KPI definitions.
Data is copied manually between systems.
There are too many spreadsheet versions.
Dashboards are not connected to a governed data model.
AI and machine learning are difficult because the data foundation is weak.
Microsoft Fabric helps address these issues by giving businesses a structured data platform where information can be ingested, stored, transformed, modelled and reported from a governed foundation.
For DataNova customers, this means spreadsheets, business systems, databases and APIs can be brought into a Microsoft Fabric pipeline, structured into semantic models and delivered through Power BI dashboards.
The result is not just better technology. It is better reporting, better governance and better decision-making.
OneLake: A Single Data Lake for the Organisation
One of the most important parts of Microsoft Fabric is OneLake.
OneLake is Microsoft Fabric’s unified logical data lake. Microsoft describes it as a single place for an organisation’s analytics data, included with every Microsoft Fabric tenant.
This matters because businesses often suffer from duplicated data. The same customer data might exist in the CRM, a spreadsheet, a reporting database, a data warehouse and several manually created exports. Every copy creates more risk, more confusion and more maintenance.
OneLake helps organisations centralise analytical data so it can be reused across different Fabric workloads.
For example:
A data engineering pipeline can prepare data in the lakehouse.
A data science notebook can use the same data for machine learning.
A Power BI semantic model can use the prepared data for reporting.
A dashboard can present the data to business users.
A governed AI experience can help summarise and explain the data.
This creates a more connected analytics environment where data does not need to be constantly moved, copied and rebuilt for every use case.
For DataNova, OneLake is a key part of the architecture because it supports a governed foundation for dashboards, paginated reports, AI analytics, machine learning and business data apps.
Data Integration and ETL in Microsoft Fabric
For most organisations, the first challenge is getting data into the platform.
Business data may come from:
Excel spreadsheets
CSV files
SharePoint folders
Dynamics 365
Salesforce
Finance systems
ERP platforms
CRM systems
SQL databases
APIs
Operational platforms
Cloud applications
Third-party systems
Microsoft Fabric includes data integration capabilities that help organisations build pipelines for extracting, transforming and loading data. Microsoft positions Fabric data integration tools as a way to unify a data estate and solve complex ETL scenarios.
ETL stands for extract, transform and load. It is the process of taking raw data from source systems, cleaning and reshaping it, then loading it into a reporting-ready environment.
In a DataNova implementation, this could mean:
Extracting sales data from Salesforce.
Extracting finance data from Dynamics 365.
Uploading budget spreadsheets.
Connecting operational databases.
Pulling API data from a third-party system.
Transforming all sources into a consistent format.
Loading the prepared data into a Fabric lakehouse.
Building a semantic model for Power BI reporting.
This is where Microsoft Fabric becomes especially powerful. It does not just store data. It supports the full journey from raw source data to trusted business insight.
Data Engineering in Microsoft Fabric
Data engineering is the foundation behind reliable analytics.
Without good data engineering, dashboards can become slow, inconsistent and difficult to trust. Data engineering ensures that raw data is cleaned, standardised, validated and structured correctly before it reaches business users.
In Microsoft Fabric, data engineering teams can build pipelines, notebooks, lakehouses and transformation processes that prepare data for reporting and analysis.
This can include:
Cleaning duplicate records.
Standardising dates, currencies and categories.
Joining CRM data to finance data.
Creating reporting tables.
Building reusable business logic.
Preparing large datasets for Power BI.
Creating machine learning feature tables.
Supporting historical trend analysis.
For businesses, this means reports become more reliable. Instead of each department building its own spreadsheet logic, the business logic can be managed centrally in the data platform.
At DataNova, this is a major part of how we help organisations modernise reporting. We do not just create dashboards. We help build the data engineering layer that makes dashboards accurate, scalable and trusted.
Lakehouse Architecture: Why It Matters
A lakehouse combines elements of a data lake and a data warehouse.
A traditional data lake can store large volumes of raw and semi-structured data. A traditional warehouse is usually more structured and optimised for SQL-based reporting. A lakehouse aims to bring these ideas together, giving organisations flexibility and structure in one architecture.
In Microsoft Fabric, the lakehouse is a key pattern for storing and preparing data for analytics.
For reporting-heavy businesses, this matters because not all data arrives in a perfect warehouse format. Some data may come from spreadsheets. Some may come from APIs. Some may be raw transactional data. Some may be semi-structured or operational.
A lakehouse approach allows organisations to land, clean, transform and model data in stages.
A common architecture might include:
Raw data layer for original ingested data.
Cleaned data layer for standardised and validated data.
Curated data layer for reporting-ready tables.
Semantic model layer for business definitions and Power BI reporting.
This makes reporting easier to govern and scale.
Direct Lake: Faster Power BI Reporting on Fabric Data
One of the most important Fabric features for Power BI users is Direct Lake.
Direct Lake is a Power BI semantic model table storage mode available in Microsoft Fabric. Microsoft explains that it is optimised for large volumes of data to be quickly loaded into memory from Delta tables in OneLake, enabling high-performance interactive analysis.
This is important because traditional Power BI reporting often relies on import refreshes or DirectQuery.
Import mode can be fast, but data must be refreshed and copied into the model.
DirectQuery avoids importing data, but performance can depend heavily on the source system.
Direct Lake provides another approach for Fabric-based architectures. It allows Power BI semantic models to work more directly with data stored in OneLake, reducing unnecessary duplication and supporting high-performance analytics over large datasets.
For businesses, the benefits can include:
Faster reporting over larger data volumes.
Reduced reliance on traditional dataset refreshes.
Better alignment between the lakehouse and Power BI.
More scalable reporting architecture.
Improved performance for Fabric-based analytics.
However, Direct Lake still needs good architecture. Poor data models, badly designed tables and inefficient measures can still create reporting problems. Direct Lake is powerful, but it is not a replacement for good data modelling.
DataNova helps organisations decide where Direct Lake makes sense, where import mode may still be suitable, and how to design semantic models that deliver strong performance for real users.
Power BI and Microsoft Fabric
Power BI is one of the most important parts of the Microsoft Fabric ecosystem.
For business users, Power BI is usually the visible layer. It is where dashboards, reports, KPIs, slicers, drill-through pages, executive dashboards and operational analytics are delivered.
Microsoft Fabric strengthens Power BI by improving the data foundation behind it.
Instead of Power BI dashboards being connected to isolated spreadsheets or disconnected exports, they can be connected to governed data in Fabric.
This supports:
Live Power BI dashboards.
Power BI Embedded reporting.
Power BI semantic models.
Power BI paginated reports.
Power BI executive dashboards.
Power BI finance reporting.
Power BI operational reporting.
Power BI customer-facing analytics.
Power BI reporting from Dynamics 365.
Power BI reporting from Salesforce.
Power BI reporting from spreadsheets and APIs.
At DataNova, Power BI is the reporting layer, but Fabric is the foundation that makes reporting scalable, governed and reliable.
Semantic Models: The Business Logic Layer
A semantic model is one of the most important parts of any Power BI and Fabric architecture.
It acts as the business logic layer between raw data and reports. It defines measures, relationships, hierarchies, calculations and KPI logic.
For example, a semantic model may define:
Revenue.
Gross margin.
Net profit.
Customer count.
Active customers.
Sales pipeline.
Forecast value.
Budget variance.
Inventory value.
Monthly recurring revenue.
Without a governed semantic model, different teams may calculate the same KPI in different ways. Finance may define revenue one way, sales another way, and operations another way. This leads to confusion and loss of trust.
With a semantic model, organisations can create one version of the truth.
This is also important for AI analytics. If AI tools are going to summarise data or answer questions, they need to work from governed business definitions rather than raw, ambiguous data.
DataNova uses semantic models to help ensure dashboards, paginated reports and AI-assisted insights are based on controlled definitions.
Microsoft Fabric for AI and Copilot
AI is becoming an increasingly important part of analytics.
Microsoft Fabric includes Copilot experiences designed to support users who create, manage and consume Fabric items. Microsoft describes Copilot in Fabric as generative AI assistive technology that aims to enhance the data analytics experience for enterprise developers, self-service users and business users.
For businesses, AI can help with:
Generating report summaries.
Explaining dashboard movements.
Assisting with data engineering tasks.
Supporting notebook development.
Helping users understand trends.
Creating automated narratives.
Assisting with data exploration.
Improving productivity for analytics teams.
But AI in analytics must be governed.
If AI interacts with raw data without structure, security or approved business definitions, it can create risk. The answers may be inconsistent, difficult to audit or based on the wrong interpretation of business data.
That is why DataNova’s approach focuses on governed AI analytics. AI should work through structured semantic models and controlled data access, not unrestricted raw databases.
This allows organisations to explore AI-powered reporting while keeping governance, security and trust at the centre of the analytics process.
Microsoft Fabric for Machine Learning and Predictive Analytics
Microsoft Fabric is not only for dashboards.
It can also support data science and machine learning use cases.
Microsoft’s Fabric data science documentation explains that predicted values can be written to OneLake and then consumed by Power BI through Direct Lake, reducing redundant data movement.
For businesses, this opens up opportunities for predictive analytics.
Common machine learning use cases include:
Revenue forecasting.
Demand forecasting.
Customer churn prediction.
Stock level prediction.
Anomaly detection.
Risk scoring.
Cash flow forecasting.
Sales pipeline prediction.
Operational performance forecasting.
Predictive maintenance.
However, machine learning depends on data quality. If the data is incomplete, inconsistent or poorly governed, predictions will be unreliable.
This is why the reporting foundation matters. Before an organisation can use machine learning effectively, it needs reliable data pipelines, clean historical data, consistent definitions and a governed analytical environment.
DataNova helps organisations start with a strong Fabric foundation, then extend into AI and machine learning where it creates practical business value.
Real-Time Analytics and Operational Insight
For many organisations, monthly reporting is no longer enough.
Operations teams may need to monitor activity daily or hourly. Sales teams may need up-to-date pipeline visibility. Service teams may need to track workload, SLAs and customer demand. Leadership may need to spot performance issues before month-end.
Microsoft Fabric includes real-time analytics capabilities that support streaming and near real-time data use cases. Microsoft positions Real-Time Intelligence in Fabric as a way to explore, analyse and act on large volumes of streaming data with high performance and low latency.
For businesses, this can support:
Live operational dashboards.
IoT reporting.
Real-time event monitoring.
Customer activity tracking.
SLA monitoring.
Exception reporting.
Inventory alerts.
Performance monitoring.
Revenue and transaction visibility.
Not every business needs true real-time reporting. Many organisations are well served by scheduled refreshes or near real-time updates. The key is designing the reporting model around the business need.
DataNova helps organisations decide what needs to be real time, what needs to be refreshed periodically, and what can remain as structured monthly reporting.
Data Governance in Microsoft Fabric
Governance is one of the biggest reasons organisations move towards Microsoft Fabric.
As reporting expands across a business, it becomes harder to manage definitions, permissions, access, lineage and data quality.
Without governance, self-service reporting can become chaotic. Users create their own exports, build their own spreadsheets and define KPIs differently. Over time, nobody knows which report is correct.
Microsoft highlights Fabric’s built-in tools for security and governance, including OneLake security and the OneLake catalog, alongside Microsoft Purview for wider governance.
A governed Fabric environment can help organisations manage:
Data access.
Data ownership.
Semantic model definitions.
Workspace structure.
Data lineage.
Security policies.
Certified datasets and reports.
Reusable business logic.
AI access boundaries.
For DataNova customers, governance is not treated as an afterthought. It is designed into the platform from ingestion to reporting.
That means users can access insights with confidence while the organisation retains control over data, definitions and permissions.
Data Security, Tenant Isolation and Access Control
Enterprise analytics requires strong security.
When organisations centralise data from finance systems, CRM platforms, ERP systems, spreadsheets and operational tools, they must ensure sensitive information is protected.
Important security principles include:
Tenant isolation.
Role-based access control.
Encryption in transit.
Encryption at rest.
Workspace-level access controls.
Controlled access to semantic models.
Secure embedded reporting.
Auditable data processes.
Governed AI access.
At DataNova, tenant isolation is a key part of the platform approach. Each customer operates in a separated environment, helping reduce the risk of cross-tenant data exposure.
This matters for organisations that need secure Power BI reporting, secure Microsoft Fabric pipelines, secure AI analytics and controlled access to dashboards across different user groups.
Security is not just about locking data away. It is about making the right data available to the right users in the right way.
Microsoft Fabric and Dynamics 365 Reporting
Dynamics 365 is one of the most important data sources for many Microsoft-based organisations.
It may contain finance data, sales data, customer data, supply chain data, project data, procurement data and operational transactions.
However, Dynamics 365 reporting can become challenging when organisations need to combine it with other sources. For example, a business may want to combine Dynamics 365 finance data with Excel budgets, Salesforce pipeline data, HR data or external market data.
Microsoft Fabric provides a foundation for bringing Dynamics 365 data into a wider analytics environment.
This supports reporting use cases such as:
Dynamics 365 finance dashboards.
Dynamics 365 sales dashboards.
Budget vs actual reporting.
Procurement reporting.
Stock and inventory reporting.
Customer performance dashboards.
Operational KPI dashboards.
Board reporting packs.
Power BI executive dashboards.
DataNova helps organisations connect Dynamics 365 data into Fabric, build governed semantic models and deliver Power BI dashboards that are easier to access and trust.
Microsoft Fabric and Salesforce Reporting
Salesforce is another major source of business data.
Many businesses use Salesforce for leads, opportunities, accounts, contacts, pipeline management and customer activity. But Salesforce reporting alone may not provide the full business picture.
Leadership may want to combine Salesforce with:
Finance data.
Invoices.
Revenue actuals.
Marketing campaigns.
Customer support data.
Product usage.
Operational performance.
Targets and budgets.
Microsoft Fabric can help bring Salesforce data into the same analytical environment as other business sources. Power BI can then provide dashboards that show pipeline, conversion, forecast, revenue, account performance and customer trends.
DataNova helps organisations turn Salesforce data into governed Power BI dashboards by connecting Salesforce to Fabric and aligning CRM data with wider business reporting.
Microsoft Fabric and Excel Reporting
Excel remains essential in many businesses.
It is used for budgets, forecasts, planning, ad hoc analysis, trackers, manual inputs and operational reporting. The goal should not always be to remove Excel completely. The goal is to stop Excel being the entire reporting infrastructure.
Microsoft Fabric can help organisations use Excel data in a more governed way.
Instead of emailing spreadsheets around the business and manually consolidating them, spreadsheet data can be uploaded, validated, stored and transformed in Fabric. From there, it can feed Power BI dashboards and semantic models.
This is especially useful for:
Budget submissions.
Forecast updates.
Manual KPI inputs.
Planning assumptions.
Operational trackers.
Data correction files.
Reference tables.
DataNova supports this by allowing organisations to bring spreadsheet data into a governed pipeline, reducing manual reporting effort while keeping the flexibility users need.
Microsoft Fabric for Paginated Reports
Not all reporting should be dashboard-based.
Many businesses still need paginated reports for formal, structured, export-ready outputs.
These may include:
Financial statements.
Board packs.
Invoices.
Customer statements.
Compliance reports.
Operational exports.
Detailed transaction listings.
Audit reports.
Management accounts.
Power BI paginated reports can use governed datasets and semantic models to produce structured reporting outputs. This means the same trusted data foundation can support both interactive dashboards and fixed-format reporting.
For finance teams especially, this is important. Dashboards are useful for exploration, but formal reporting packs often need consistent layouts, page breaks, headers, footers and export formats.
DataNova supports both Power BI dashboards and paginated reporting patterns, helping organisations move from manual reporting packs to governed, repeatable reporting outputs.
Why Microsoft Fabric Is Important for Modern Data Strategy
Microsoft Fabric matters because it brings together many parts of the data lifecycle.
A modern data strategy needs more than dashboards. It needs ingestion, storage, transformation, governance, modelling, security, reporting, AI and scalability.
Fabric supports this wider strategy by providing one connected analytics platform.
For businesses, this can help reduce:
Manual reporting.
Data duplication.
Tool fragmentation.
Inconsistent KPIs.
Spreadsheet dependency.
Slow reporting cycles.
Siloed analytics.
Uncontrolled AI usage.
Poor data governance.
At the same time, it can improve:
Power BI performance.
Reporting trust.
Data accessibility.
Governance.
Security.
Scalability.
Machine learning readiness.
AI analytics readiness.
Operational visibility.
Executive decision-making.
This makes Fabric especially relevant for organisations that want to modernise reporting without building a complex data platform from scratch.
How DataNova Uses Microsoft Fabric
DataNova uses Microsoft Fabric as the foundation for a fully managed analytics platform.
Our approach is designed to help organisations move from fragmented data to live Power BI reporting without needing to manage the full BI stack internally.
A typical DataNova architecture may include:
Spreadsheet uploads.
Business system connections.
API integrations.
CRM and ERP data ingestion.
Microsoft Fabric lakehouse storage.
Automated data pipelines.
Data engineering transformations.
Governed semantic models.
Power BI Embedded dashboards.
Paginated reports.
AI-assisted insights.
Machine learning readiness.
Secure tenant isolation.
Role-based access control.
This gives customers a practical way to benefit from Microsoft Fabric without having to design, build and manage every part of the platform themselves.
DataNova focuses on the end-to-end outcome: trusted data, automated pipelines and live reporting that users can actually rely on.
Microsoft Fabric Keywords Businesses Are Searching For
For organisations researching Microsoft Fabric, the most common search topics often include:
Microsoft Fabric reporting.
Microsoft Fabric Power BI.
Microsoft Fabric dashboards.
Microsoft Fabric lakehouse.
Microsoft Fabric OneLake.
Microsoft Fabric Direct Lake.
Microsoft Fabric data engineering.
Microsoft Fabric ETL.
Microsoft Fabric data pipelines.
Microsoft Fabric data warehouse.
Microsoft Fabric semantic models.
Microsoft Fabric AI.
Microsoft Fabric Copilot.
Microsoft Fabric machine learning.
Microsoft Fabric data governance.
Microsoft Fabric security.
Microsoft Fabric Dynamics 365 reporting.
Microsoft Fabric Salesforce reporting.
Microsoft Fabric Power BI Embedded.
Microsoft Fabric paginated reports.
Microsoft Fabric analytics platform.
These are not separate ideas. They are connected parts of the same modern analytics strategy.
A business does not need Fabric just because it is new technology. A business needs Fabric when it wants to centralise data, automate reporting, govern metrics, support Power BI dashboards and prepare for AI-driven analytics.
Final Thoughts: Fabric Is the Foundation, Insight Is the Goal
Microsoft Fabric is not just another reporting tool.
It is a unified data platform that can support the full analytics journey from raw data to business insight. It brings together data integration, data engineering, OneLake, Direct Lake, semantic models, Power BI, AI, machine learning, governance and real-time analytics.
For organisations still relying on disconnected spreadsheets, manual reporting packs and fragmented dashboards, Fabric provides a path towards a more scalable and trusted data foundation.
But technology alone is not enough.
The real value comes from applying Fabric to real business problems: finance reporting, sales dashboards, operational analytics, executive reporting, customer insight, forecasting, AI analytics and governed decision-making.
DataNova helps organisations turn Microsoft Fabric into a practical reporting and analytics platform.
By connecting spreadsheets, business systems, databases and APIs into automated Fabric pipelines, DataNova delivers governed Power BI dashboards and trusted reporting outputs that help teams make better decisions faster.
Microsoft Fabric provides the foundation. DataNova turns that foundation into live business insight.